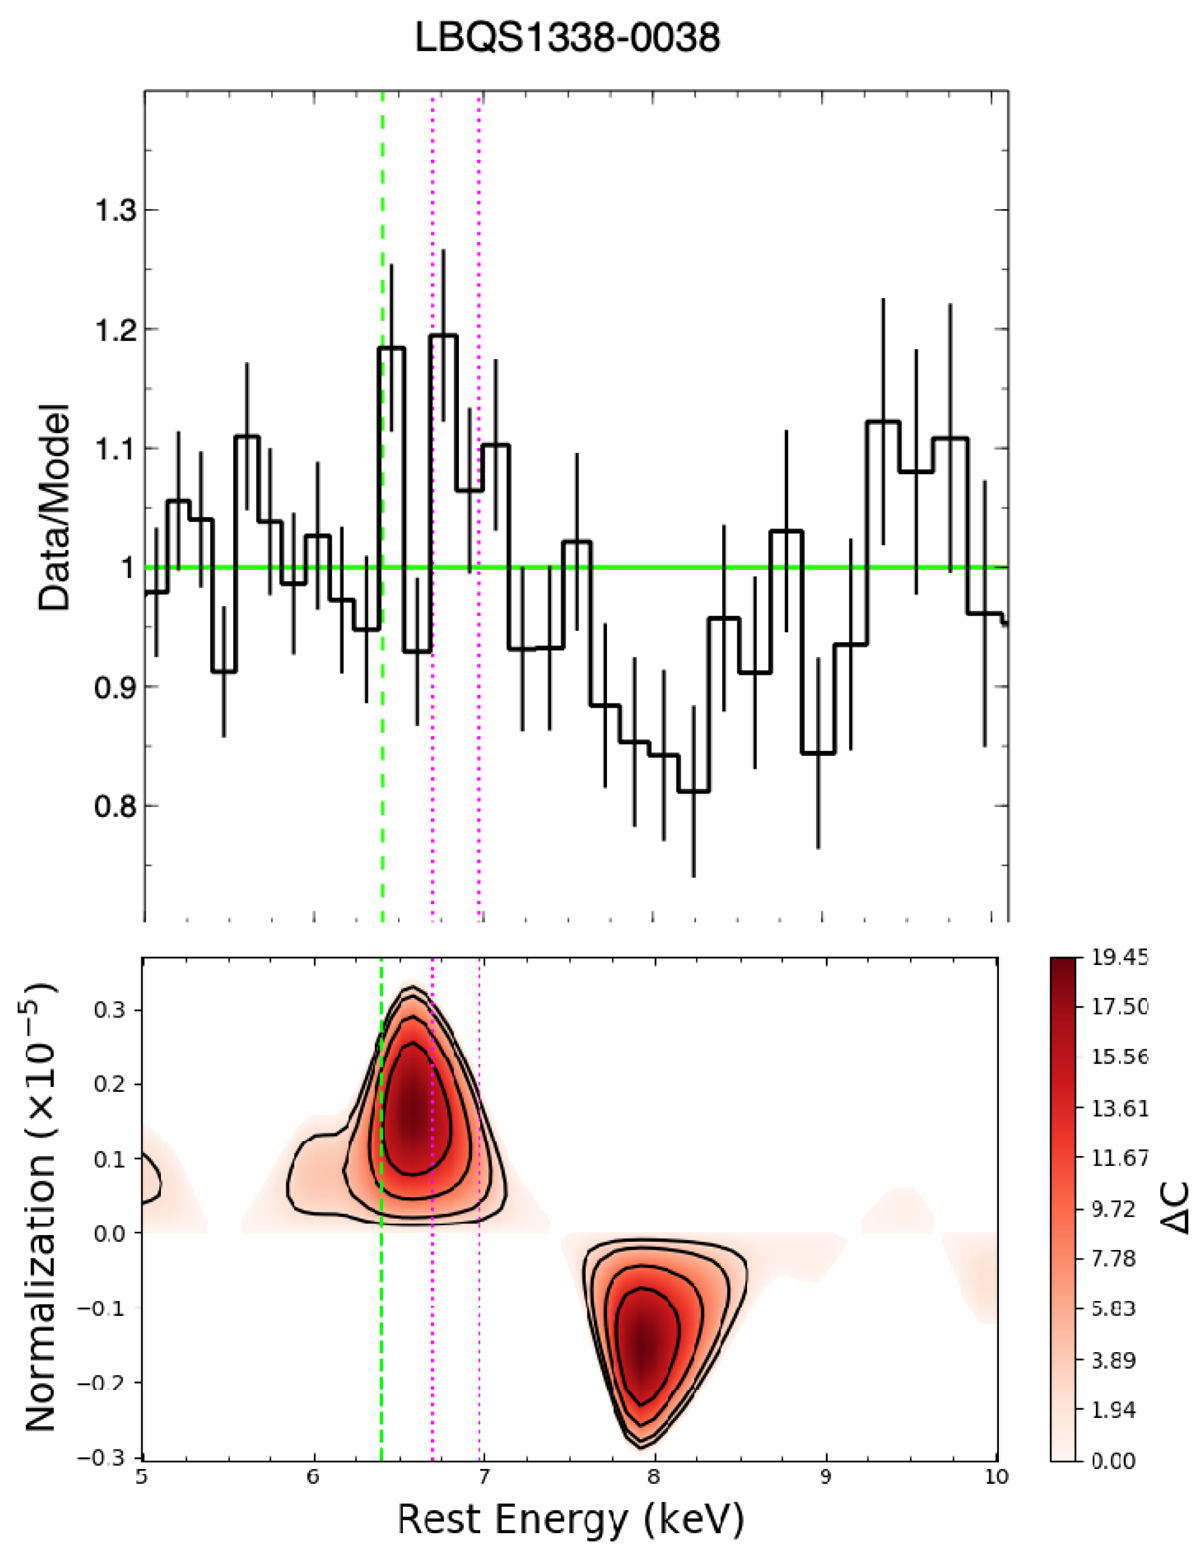
Fig. 4.
Download original image
Plot of the residuals and the corresponding closed confidence contours plot from the blind scan of the type 1 AGN LBQS 1338−0038. Top: data/model ratio plot for the EPIC-pn spectrum (MOS 1 and MOS 2 are not included for clarity), showing the residuals in the 5–10 keV band. A broad emission and absorption profiles are seen at ∼ 6.6 keV and ∼ 8 keV, respectively, suggesting a P Cygni-like profile. The vertical lines indicate the Fe Kα laboratory transition at Elab = 6.40 keV (lime green) and Fe XXV and Fe XXVI at Elab = 6.70 keV and 6.97 keV, respectively (magenta). The outer to inner closed contours correspond to a Δ𝒞 significance of (−2.3 = 68%), (−4.61 = 90%), (−9.21 = 99%), and (−13.82 = 99.9%) relative to the best-fitting continuum. Bottom: corresponding blind-search contours, showing the evidence of strong emission profiles at high confidence level (see the colour bar on the right).
Current usage metrics show cumulative count of Article Views (full-text article views including HTML views, PDF and ePub downloads, according to the available data) and Abstracts Views on Vision4Press platform.
Data correspond to usage on the plateform after 2015. The current usage metrics is available 48-96 hours after online publication and is updated daily on week days.
Initial download of the metrics may take a while.