Open Access
Fig. 1.
Download original image
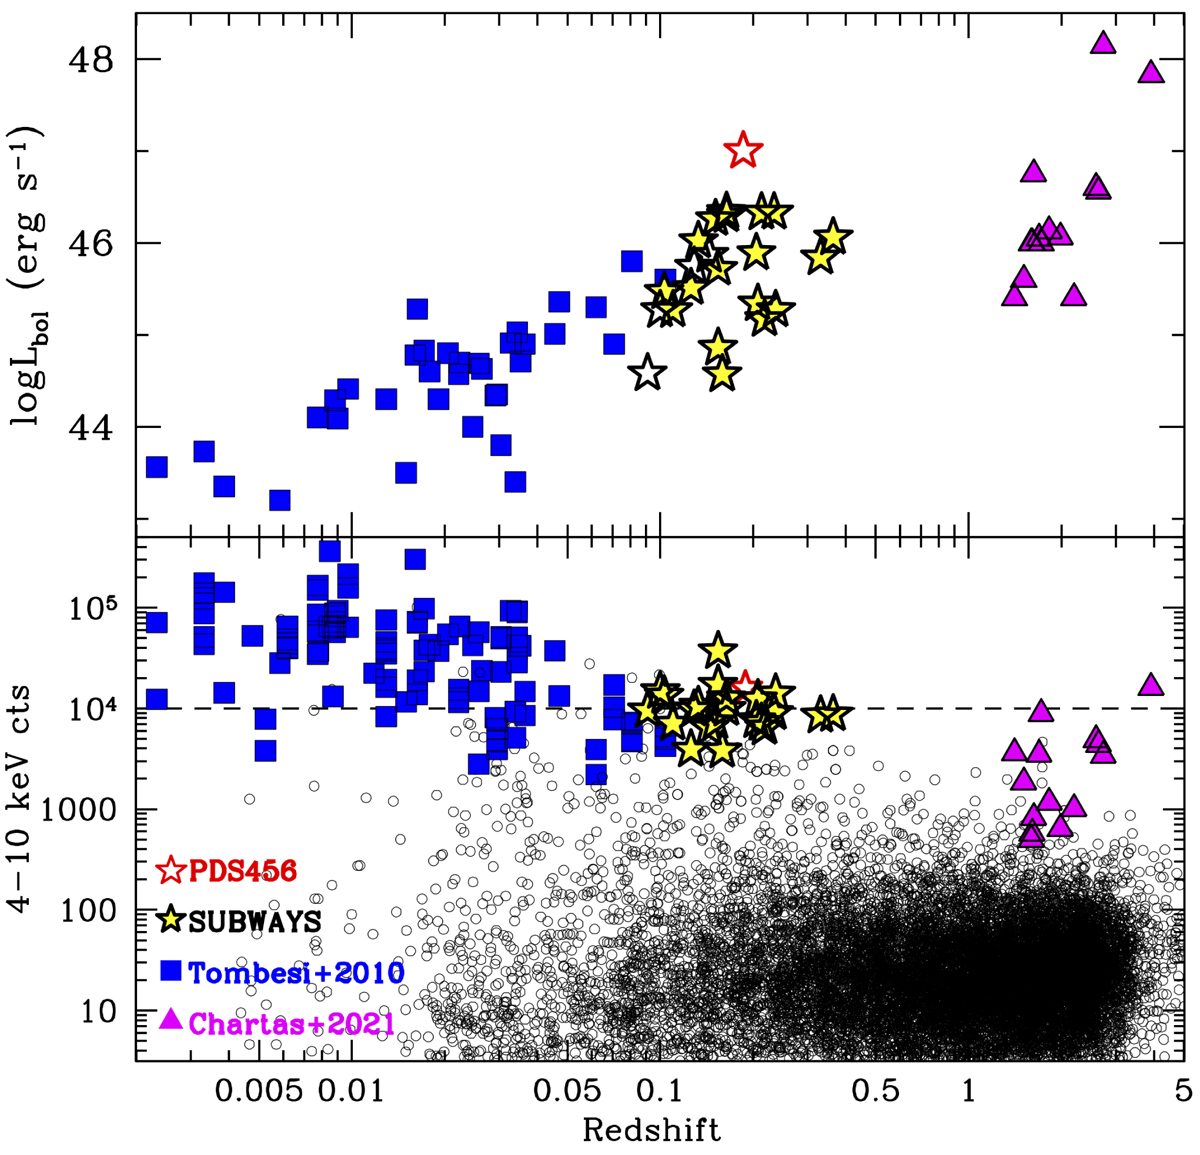
Luminosity (upper panel) and rest-frame 4–10 keV counts (lower panel) plotted against redshift for the objects in the SUBWAYS sample and the comparison samples (T10; C21), as labelled. In the lower panel we also mark the sources of the 3XMM sample, used to select the SUBWAYS targets, with small empty circles.
Current usage metrics show cumulative count of Article Views (full-text article views including HTML views, PDF and ePub downloads, according to the available data) and Abstracts Views on Vision4Press platform.
Data correspond to usage on the plateform after 2015. The current usage metrics is available 48-96 hours after online publication and is updated daily on week days.
Initial download of the metrics may take a while.