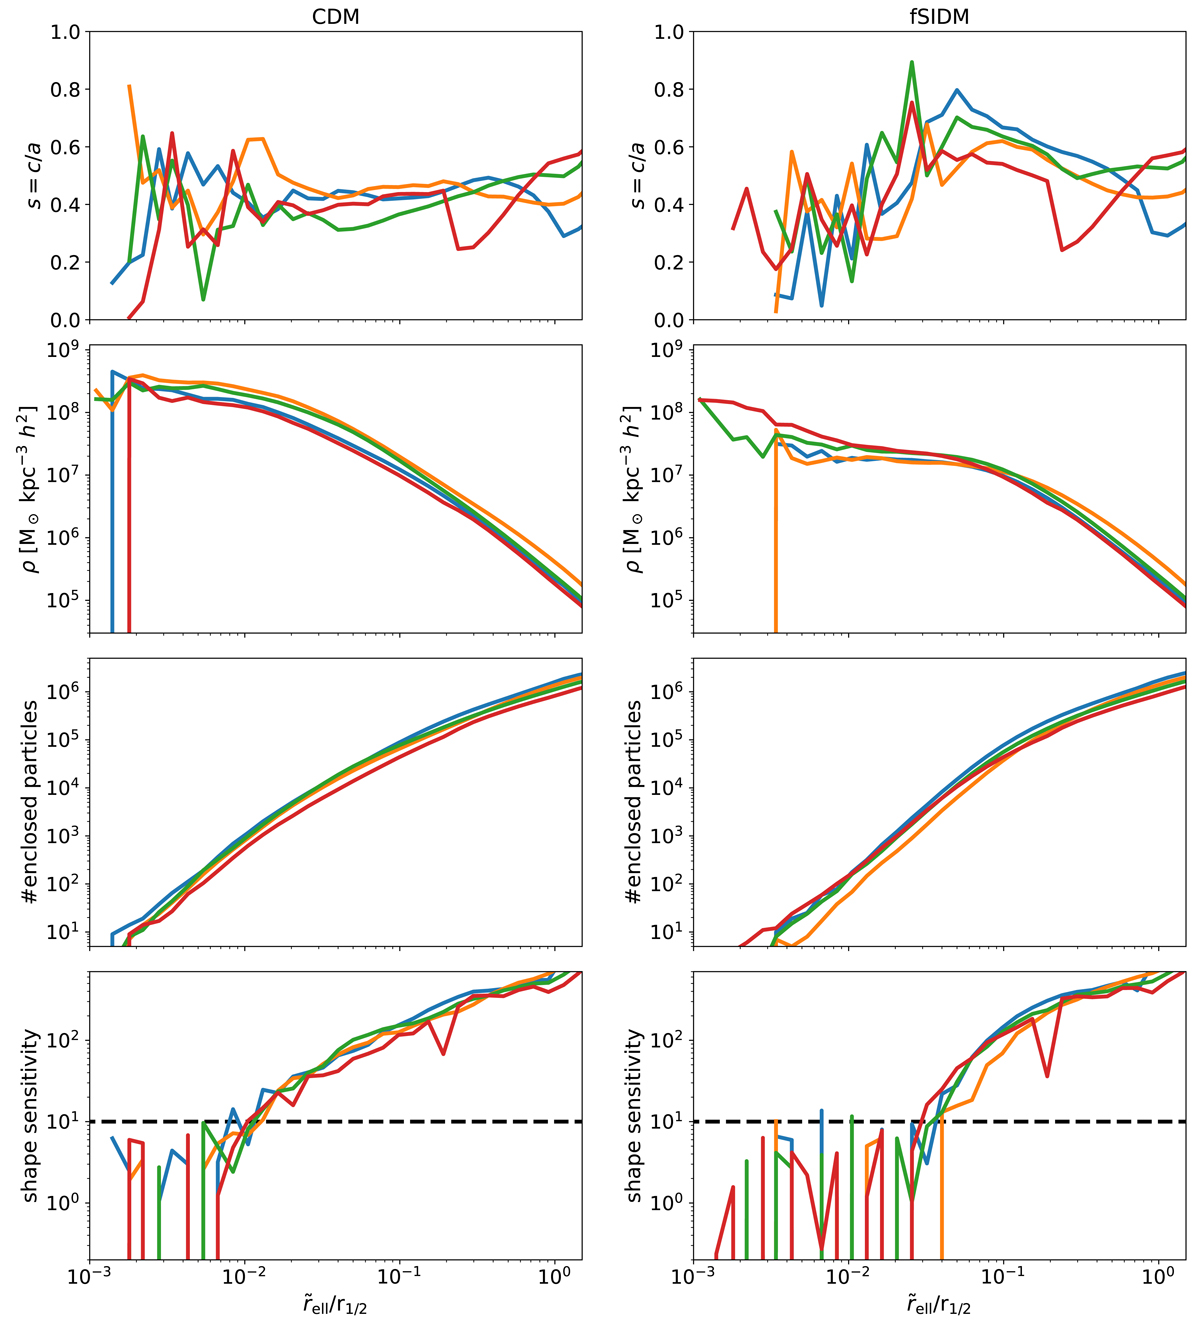
Fig. 2.
Download original image
Various quantities for the CDM (right-hand side) and fSIDM (left-hand side) haloes (the colours are the same as in Fig. 1) are shown as a function of r̃ell. First row: shape profile as the ratio of the major and minor axis is shown. The mass tensor was measured within ellipsoids. Second row: density profile is shown as inferred from the ellipsoids used for the shape measurement by taking the differences in mass and volume between two consecutive ellipsoids. Third row: number of particles enclosed in the ellipsoid is shown. Fourth row: shape sensitivity, ξ, is shown according to Eq. (9). Here the vertical line indicates the criterion above which the shape was measured accurately, ξ = 10.
Current usage metrics show cumulative count of Article Views (full-text article views including HTML views, PDF and ePub downloads, according to the available data) and Abstracts Views on Vision4Press platform.
Data correspond to usage on the plateform after 2015. The current usage metrics is available 48-96 hours after online publication and is updated daily on week days.
Initial download of the metrics may take a while.