Fig. 1.
Download original image
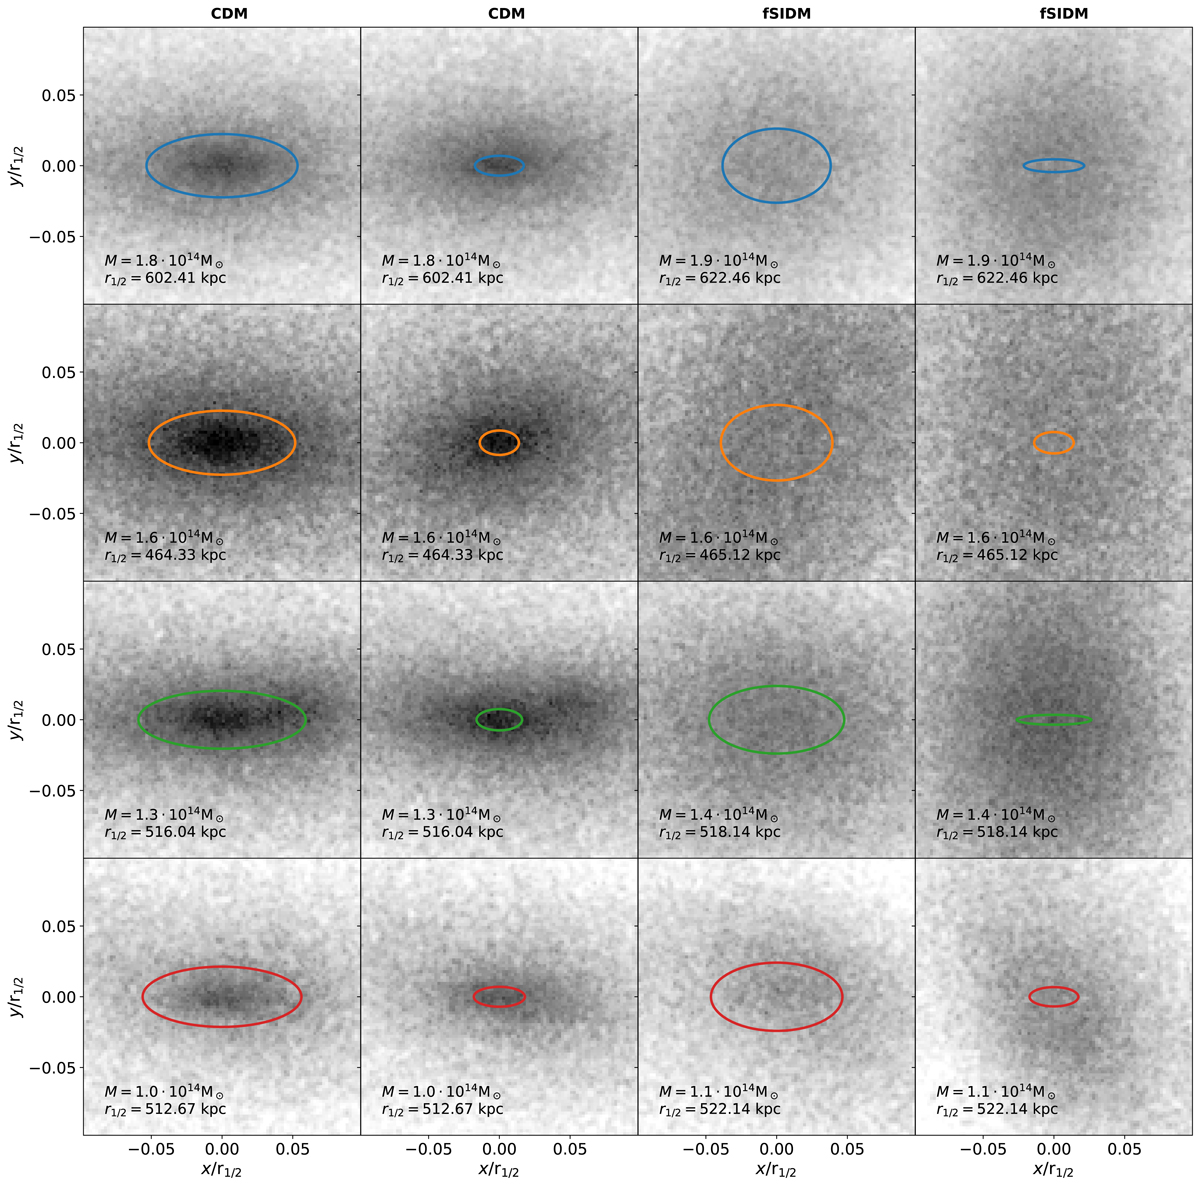
DM surface density is shown for the primary subhaloes simulated with CDM (the two left columns) and fSIDM with ![]() cm2 g−1 (the two right columns). We note that the colour scaling is logarithmic. The shapes were measured within a volume of V = 4/3 π (0.032 r1/2)3 (odd columns) and V = 4/3 π (0.0105 r1/2)3 (even columns). They are illustrated with coloured ellipses. The haloes are shown face-on according to the measured shapes. We matched the haloes across the simulation, where matched haloes are shown in the same row and the same colour is used for the ellipses.
cm2 g−1 (the two right columns). We note that the colour scaling is logarithmic. The shapes were measured within a volume of V = 4/3 π (0.032 r1/2)3 (odd columns) and V = 4/3 π (0.0105 r1/2)3 (even columns). They are illustrated with coloured ellipses. The haloes are shown face-on according to the measured shapes. We matched the haloes across the simulation, where matched haloes are shown in the same row and the same colour is used for the ellipses.
Current usage metrics show cumulative count of Article Views (full-text article views including HTML views, PDF and ePub downloads, according to the available data) and Abstracts Views on Vision4Press platform.
Data correspond to usage on the plateform after 2015. The current usage metrics is available 48-96 hours after online publication and is updated daily on week days.
Initial download of the metrics may take a while.