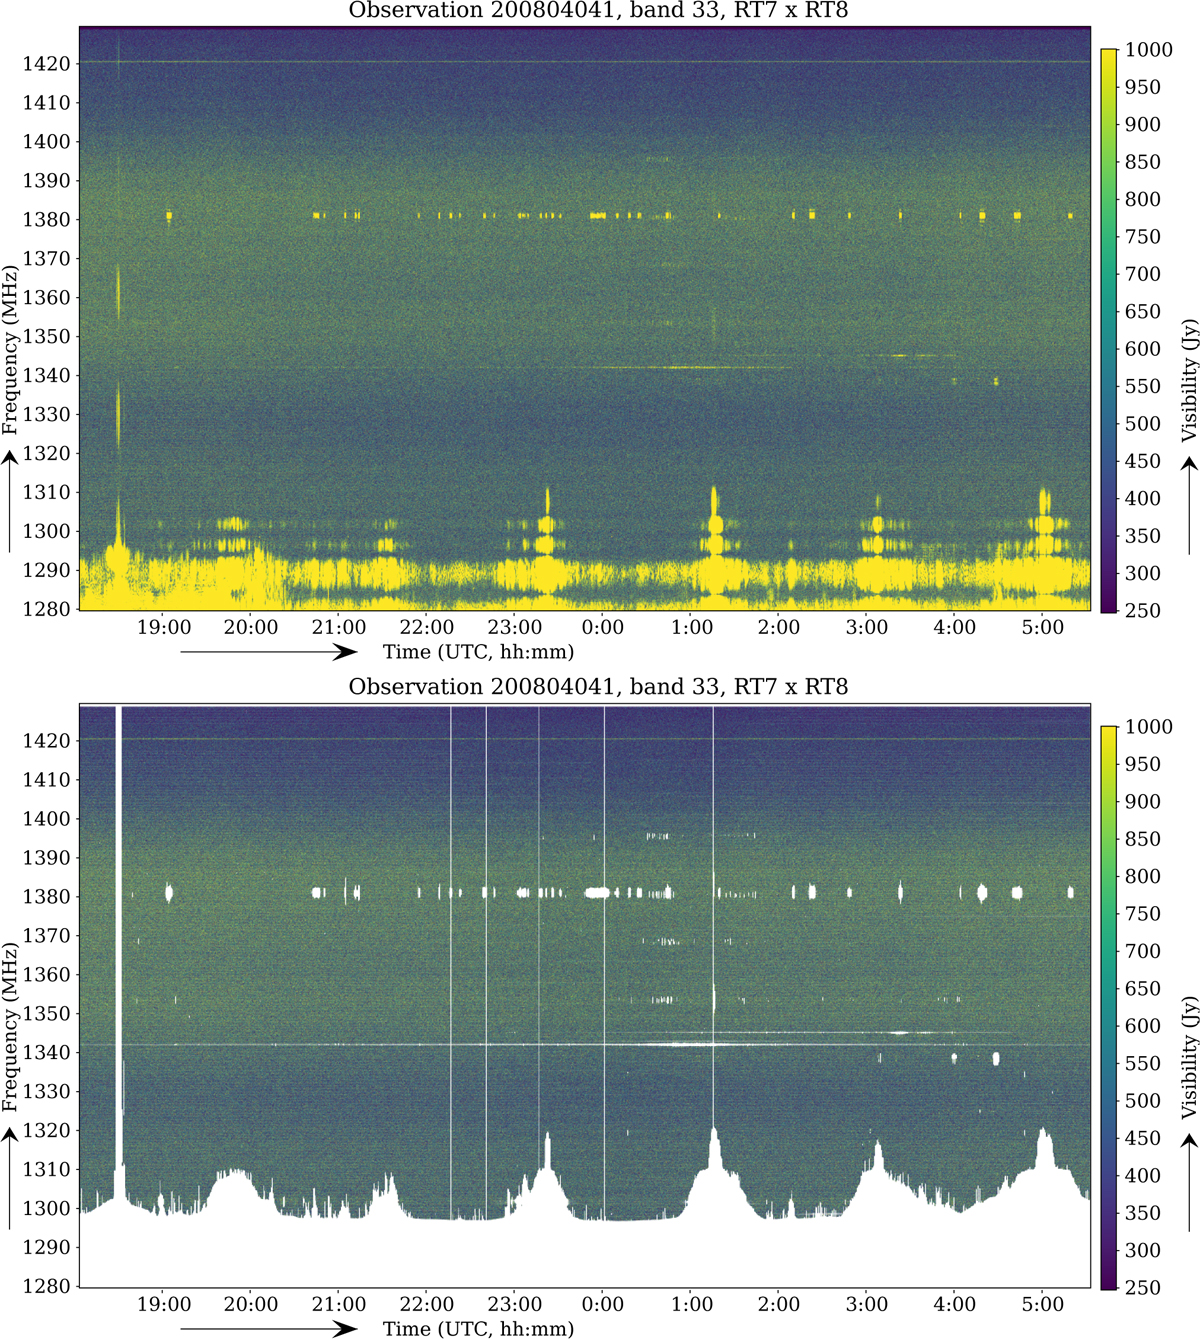
Fig. 7
Download original image
Typical flagging result for a single baseline in a wideband observation. The top panel shows the input visibilities, and the bottom panel shows the visibilities overlaid with the detection result in white. These plots show the Stokes I visibilities. Some interference features are only visible in Stokes Q, U or V, such as the vertical features around midnight. All interference features have successfully been detected, and no obvious undesirable detections are visible, with the exception of horizontal flagged features every 200 kHz, caused by the sub-band bandpass (see Fig. 4). 18% of the data gets flagged for the baseline in this observation.
Current usage metrics show cumulative count of Article Views (full-text article views including HTML views, PDF and ePub downloads, according to the available data) and Abstracts Views on Vision4Press platform.
Data correspond to usage on the plateform after 2015. The current usage metrics is available 48-96 hours after online publication and is updated daily on week days.
Initial download of the metrics may take a while.