Fig. 6
Download original image
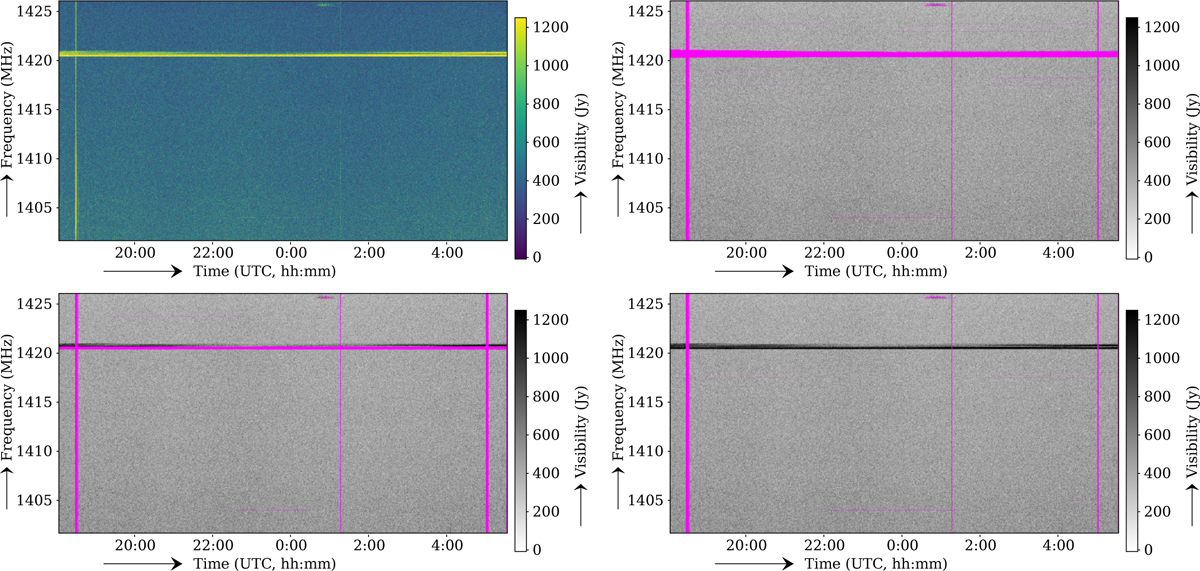
Band-pass corrected M31 data from WSRT RT9 × RTA with a strong HI signal. Top-left image: input data. The bright emission around 1420 MHz is from HI and should not be flagged. The vertical lines are instrument or RFI artefacts that should be flagged. Top-right image: after RFI detection without HI modifications, showing in pink what is flagged. Bottom-left image: after RFI detection using Stokes Q, U and V. Bottom-right image: after RFI detection using a specialized strategy for 1418–1424 MHz.
Current usage metrics show cumulative count of Article Views (full-text article views including HTML views, PDF and ePub downloads, according to the available data) and Abstracts Views on Vision4Press platform.
Data correspond to usage on the plateform after 2015. The current usage metrics is available 48-96 hours after online publication and is updated daily on week days.
Initial download of the metrics may take a while.