Fig. 5

Download original image
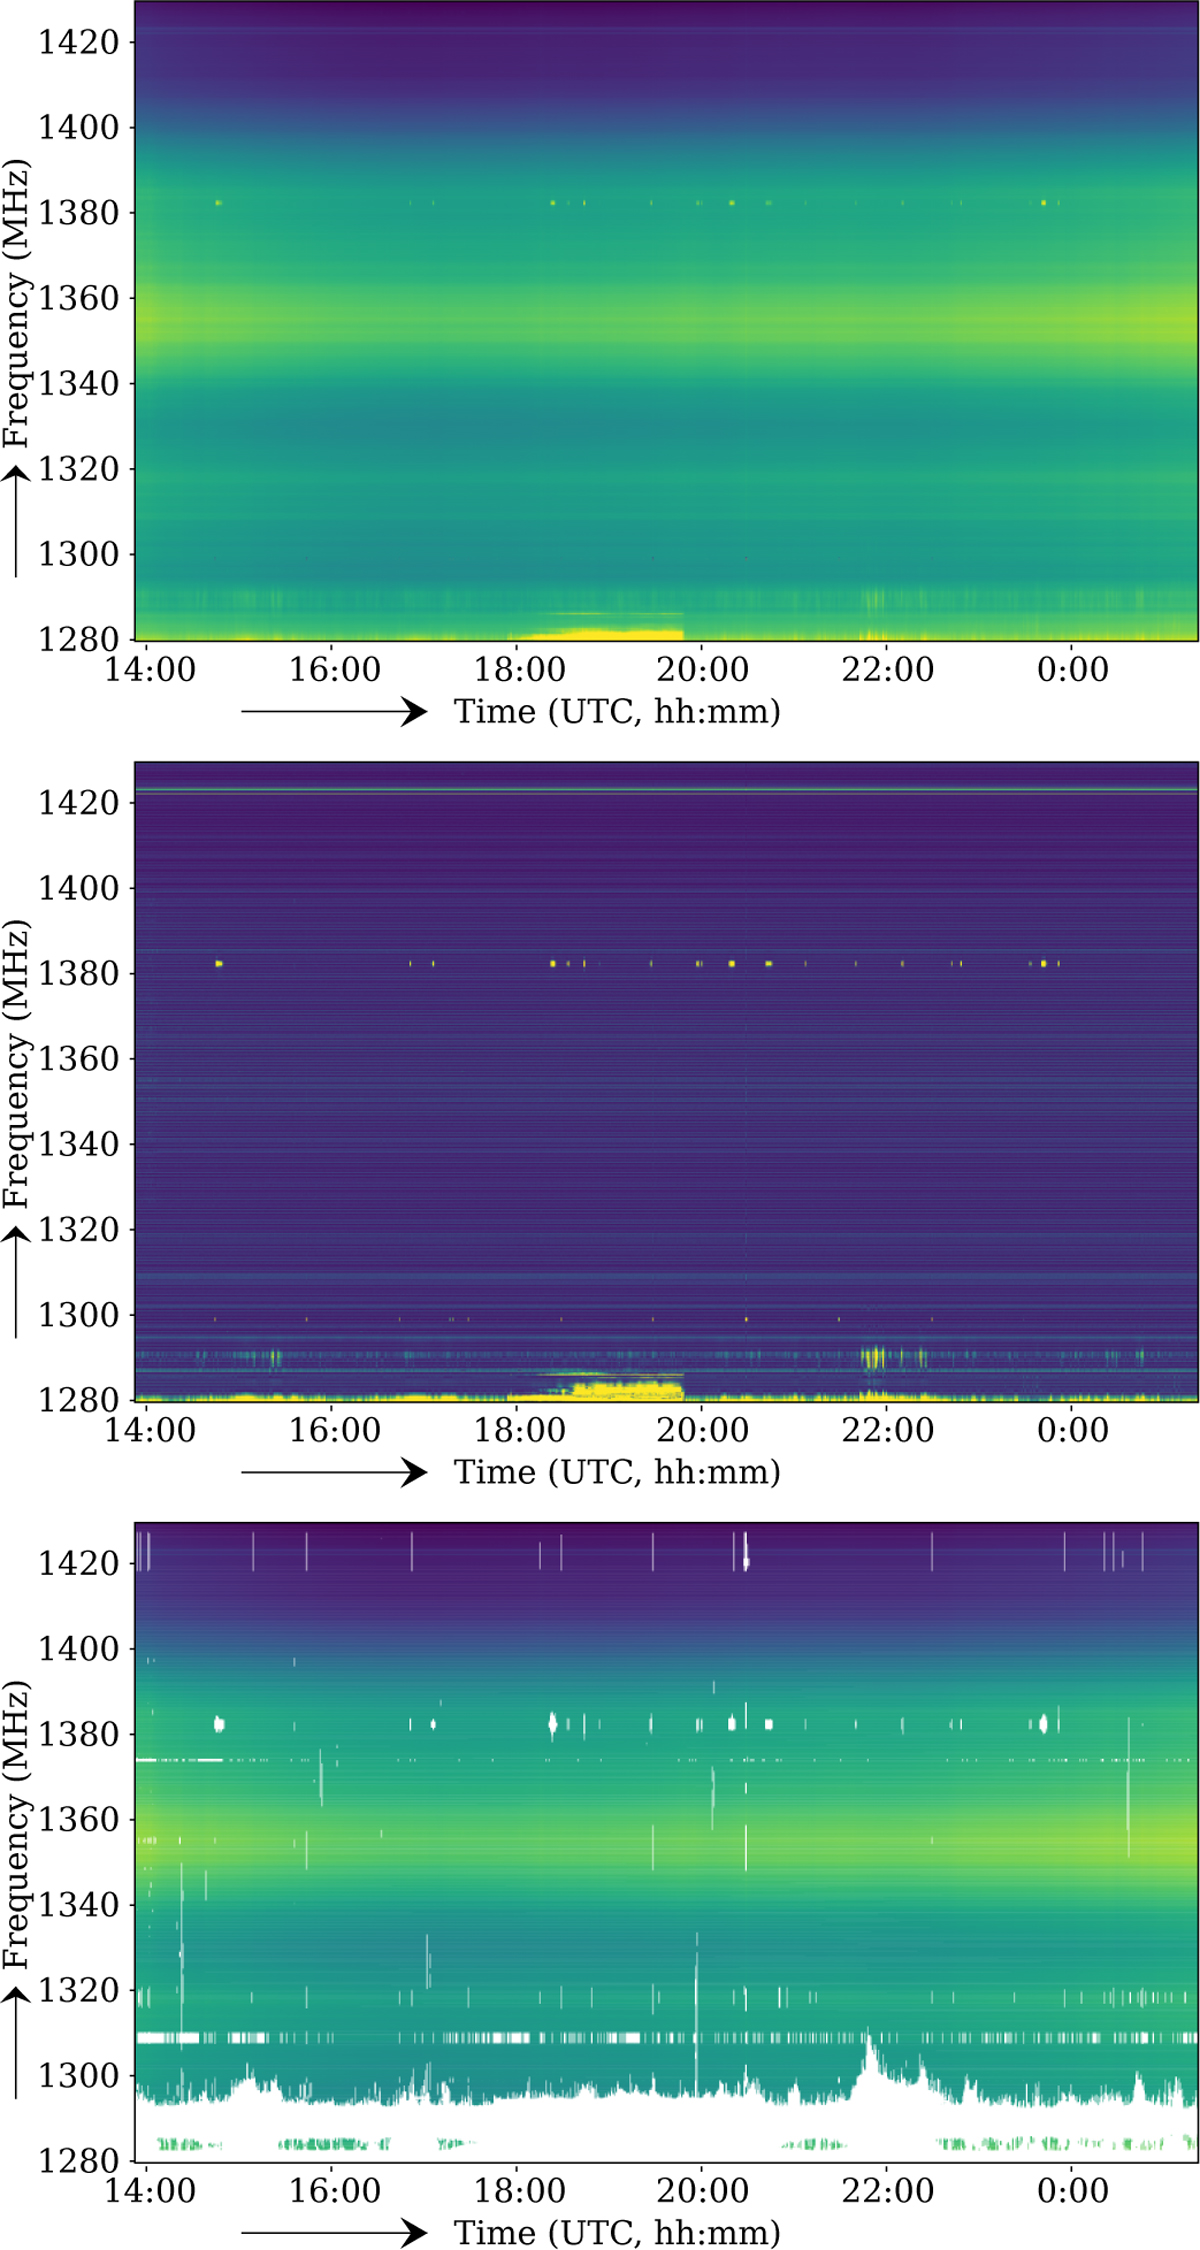
Flagging of auto-correlations. Top image: input after subband band-pass correction; centre image: same after iterative high-pass filtering and with 10x more sensitive colour scale; bottom image: after flagging with the auto-correlation specific strategy. Because autocorrelations have different properties compared to cross-correlations, they require a specialized flagging strategy.
Current usage metrics show cumulative count of Article Views (full-text article views including HTML views, PDF and ePub downloads, according to the available data) and Abstracts Views on Vision4Press platform.
Data correspond to usage on the plateform after 2015. The current usage metrics is available 48-96 hours after online publication and is updated daily on week days.
Initial download of the metrics may take a while.


