Fig. 2
Download original image
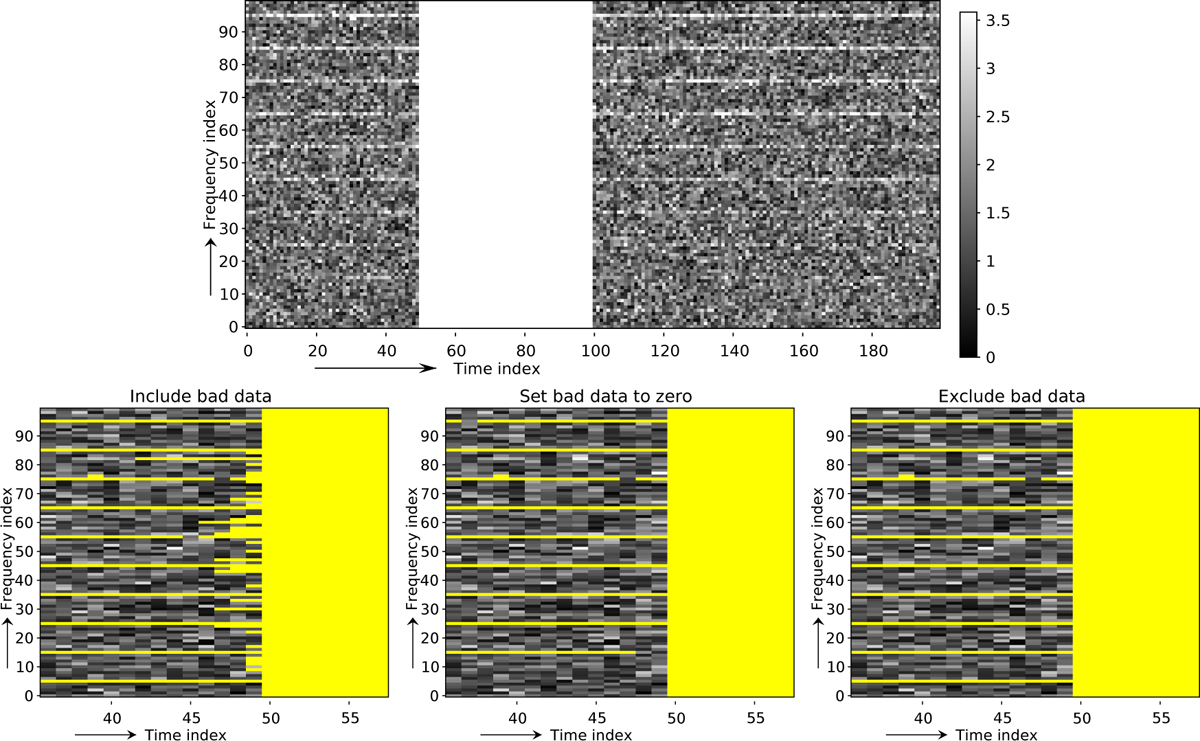
Three methods of handling invalid data in the SUMTHRESHOLD step. The top image shows the simulated input data, which consists of Gaussian complex noise, spectral line RFI every 10 channels that increases in strength in frequency direction, and a block of invalid data (time indices 50–100), simulating e.g. a temporary correlator failure. The bottom images show a zoom in on the left edge of the invalid data. Flagged data is marked in yellow. Bottom-left: normal SUMTHRESHOLD without using knowledge of the invalid data; bottom-centre: invalid samples are set to zero before SUMTHRESHOLD; bottom-right: invalid samples are removed before SUMTHRESHOLD.
Current usage metrics show cumulative count of Article Views (full-text article views including HTML views, PDF and ePub downloads, according to the available data) and Abstracts Views on Vision4Press platform.
Data correspond to usage on the plateform after 2015. The current usage metrics is available 48-96 hours after online publication and is updated daily on week days.
Initial download of the metrics may take a while.