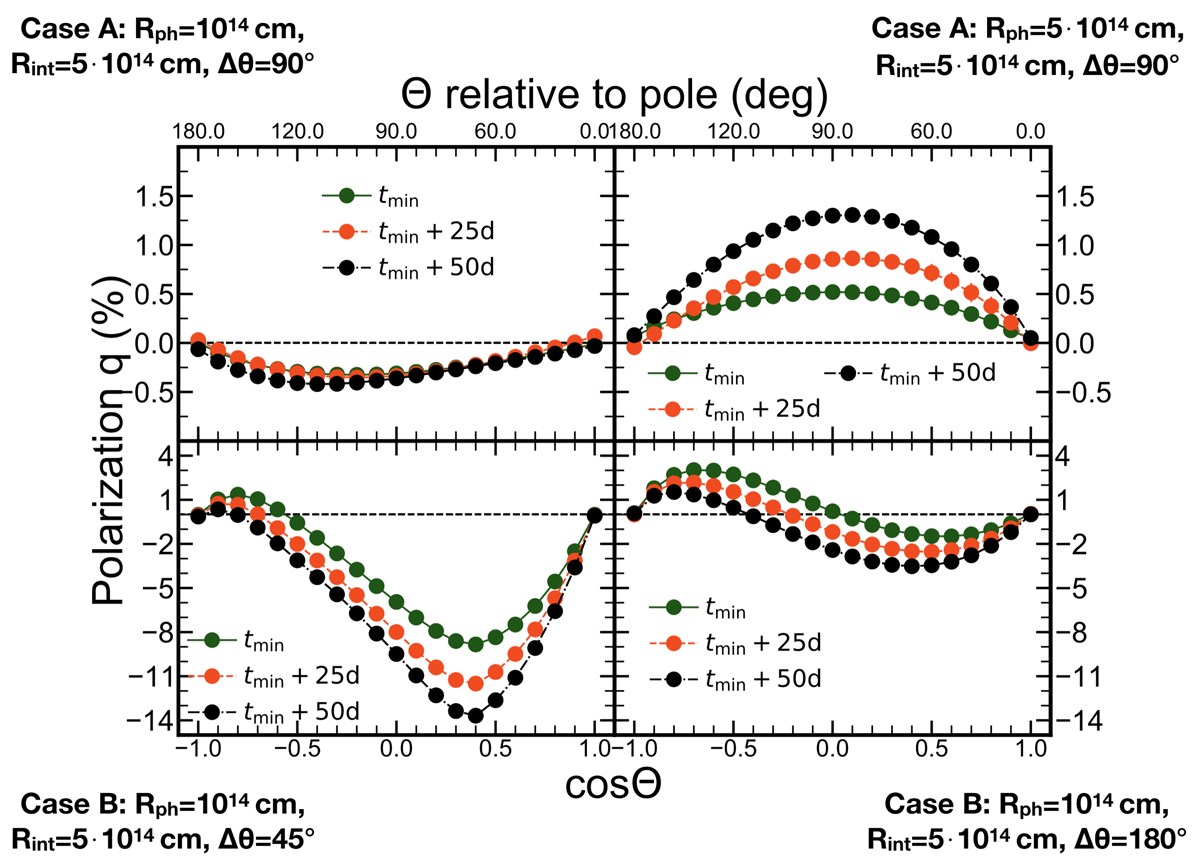
Fig. 6.
Download original image
Time evolution of the polarization as a function of the viewing angle. Each one of the four subplots of this plot probes a specific simulation setup, which is those discussed in Figs. 4 and 5. s1 and s2 (of Fig. 4) are in the top left and right panels respectively while s3 and s4 (of Fig. 5) are in the bottom left and right panels respectively. The different colors represent a time snapshot of this specific simulation, with green being the (already presented) t = tmind, orange being the t = tmin+25d and black being the t = tmin+50d. In general, we do observe a change of polarization with time and the time evolution from tmin seems to favor higher maximum P values. However, it could result in lower observed P values for observers at specific viewing angles.
Current usage metrics show cumulative count of Article Views (full-text article views including HTML views, PDF and ePub downloads, according to the available data) and Abstracts Views on Vision4Press platform.
Data correspond to usage on the plateform after 2015. The current usage metrics is available 48-96 hours after online publication and is updated daily on week days.
Initial download of the metrics may take a while.