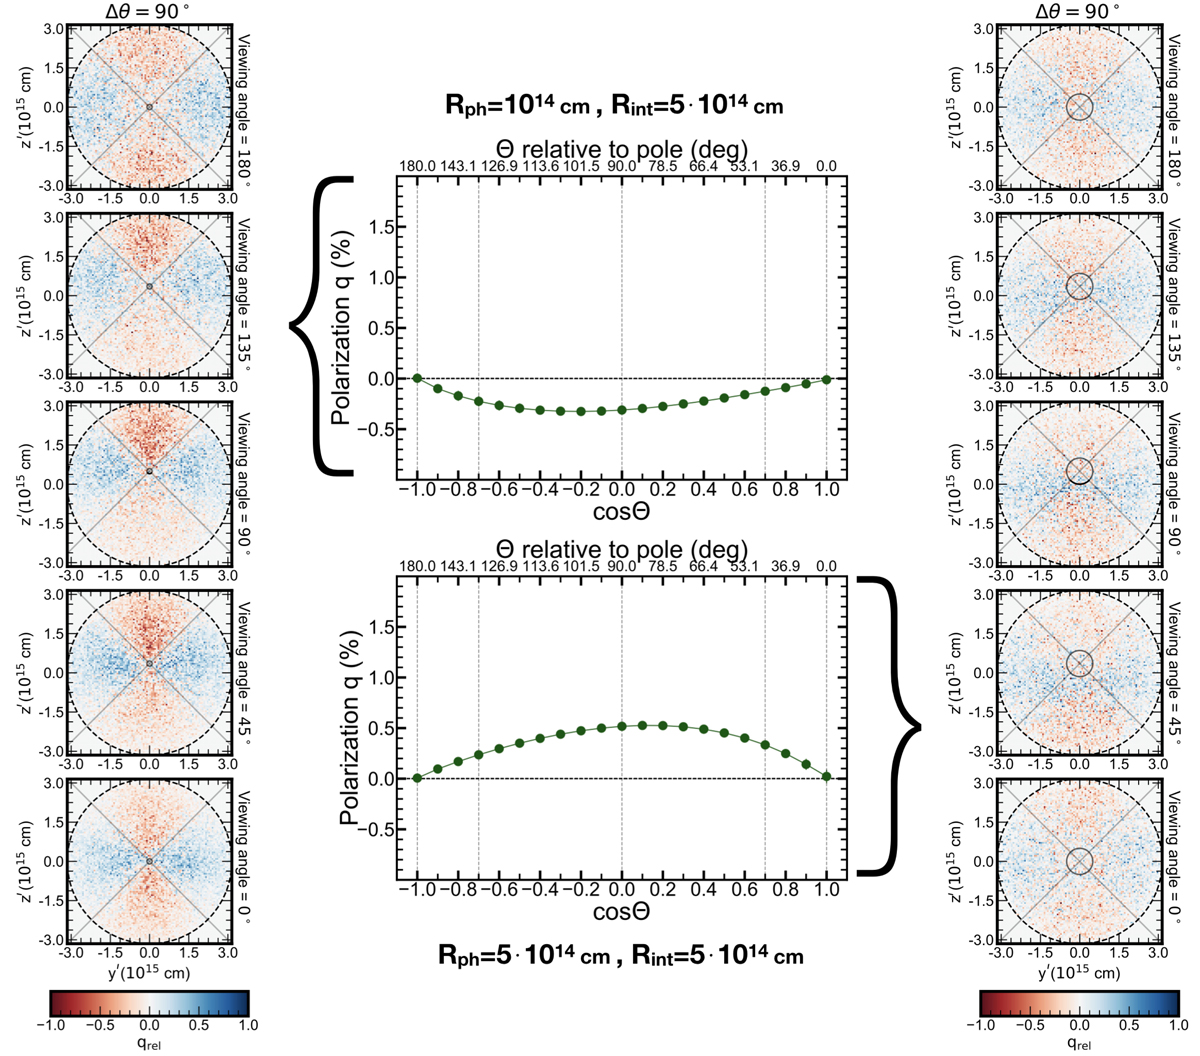
Fig. 4.
Download original image
Case A, Ṁp = 2.93 M⊙ yr−1. Investigating the polarization as a function of the viewing angle Θ for two simulations: s1; Rph = 1014 cm, Rint = 5 × 1014 cm, Δθ = 90° (left column and top panel of middle column) and s2; Rph = 5 × 1014 cm, Rint = 5 × 1014 cm, Δθ = 90° (right column and bottom panel of middle column). The middle column plots show the polarization as a function of the viewing angle for each particular simulation (identical with Fig. 2). The vertical dashed lines denote five different viewing angles which correspond to each subplot of the left and right column. The left and right column subplots show the contribution of each single photon in the final polarization value (relative normalized polarization colormap values) for five different viewing angles (Θ) which from top to bottom are: Θ = 180° ,135° ,90° ,45° and 0°. Red color denotes a negative q (i.e., oscillation of the electric field in the horizontal direction) and blue color denotes a positive q(i.e., oscillation of the electric field in the vertical direction). The solid line circle in these subplots denotes the projection of the photosphere with radius Rph while the black dashed line circle denotes the projection (for each observer) of the outflow (and the grid’s) outer radius Rmax. The electron scattering photosphere dsc_ph is not plotted in this case simply because the density in the outflow is so high that τ > 1 everywhere inside Rmax. Since each subplot is a 2D projection for a specific viewing angle, there is a rotation of coordinates in the xz plane. Hence y′ = y and z′ = z ⋅ cos ϕ − x ⋅ sin ϕ where ϕ is the rotation angle which corresponds to ϕ = −90° , − 45° ,0° ,45° and 90° for each respective viewing angle Θ. The four quadrants are plotted only as a visual aid.
Current usage metrics show cumulative count of Article Views (full-text article views including HTML views, PDF and ePub downloads, according to the available data) and Abstracts Views on Vision4Press platform.
Data correspond to usage on the plateform after 2015. The current usage metrics is available 48-96 hours after online publication and is updated daily on week days.
Initial download of the metrics may take a while.