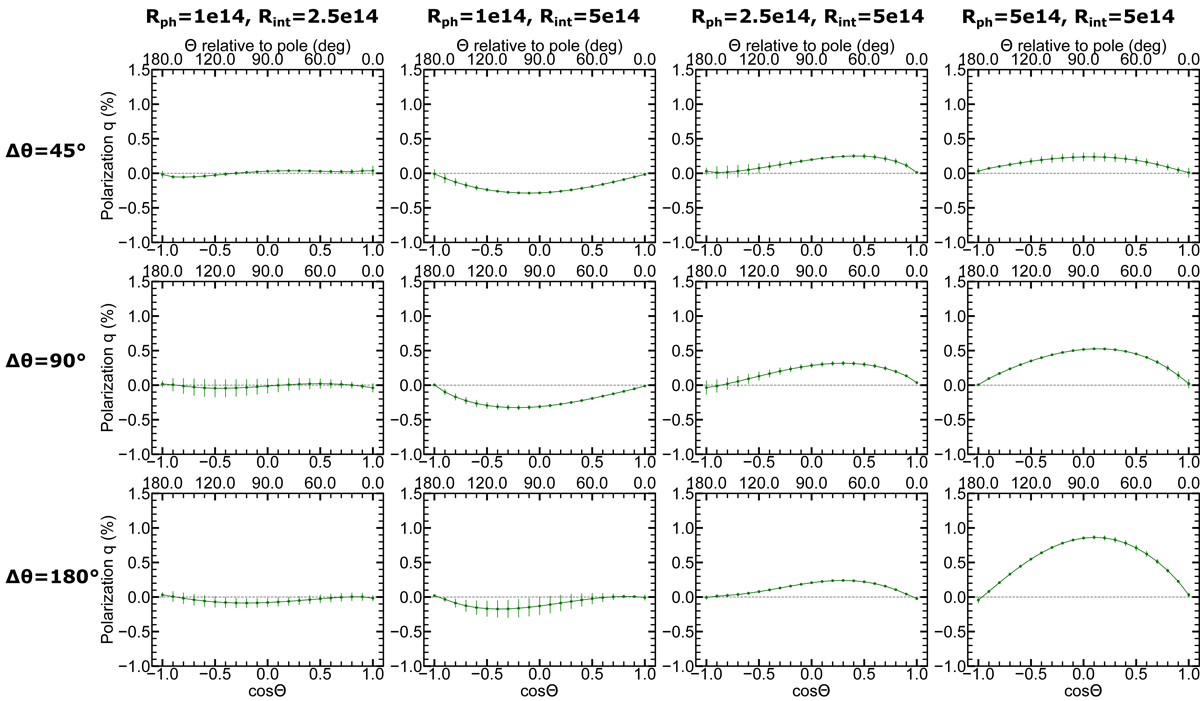
Fig. 2.
Download original image
Polarization levels for the 12 simulations of the high mass outflow rate scenario (Case A, Ṁp = 2.93 M⊙ yr−1). The different columns of the plot represent the different combinations of Rph and Rint that we modeled in this work and the different rows represent the three different Δθ (see Sect. 2 for an explanation of the choice of those values). Each subplot shows the degree of the polarization P as a function of the 21 viewing angles Θ, equally spaced in cosine (ΔcosΘ = 0.1) between a north-polar (cosΘ = 1, face-on) and a south-polar (cosΘ = −1, face-on) orientation. We find that this configuration results in polarization levels below one (P < 1%) for all viewing angles and for 10/12 simulations (P < 0.5%).
Current usage metrics show cumulative count of Article Views (full-text article views including HTML views, PDF and ePub downloads, according to the available data) and Abstracts Views on Vision4Press platform.
Data correspond to usage on the plateform after 2015. The current usage metrics is available 48-96 hours after online publication and is updated daily on week days.
Initial download of the metrics may take a while.