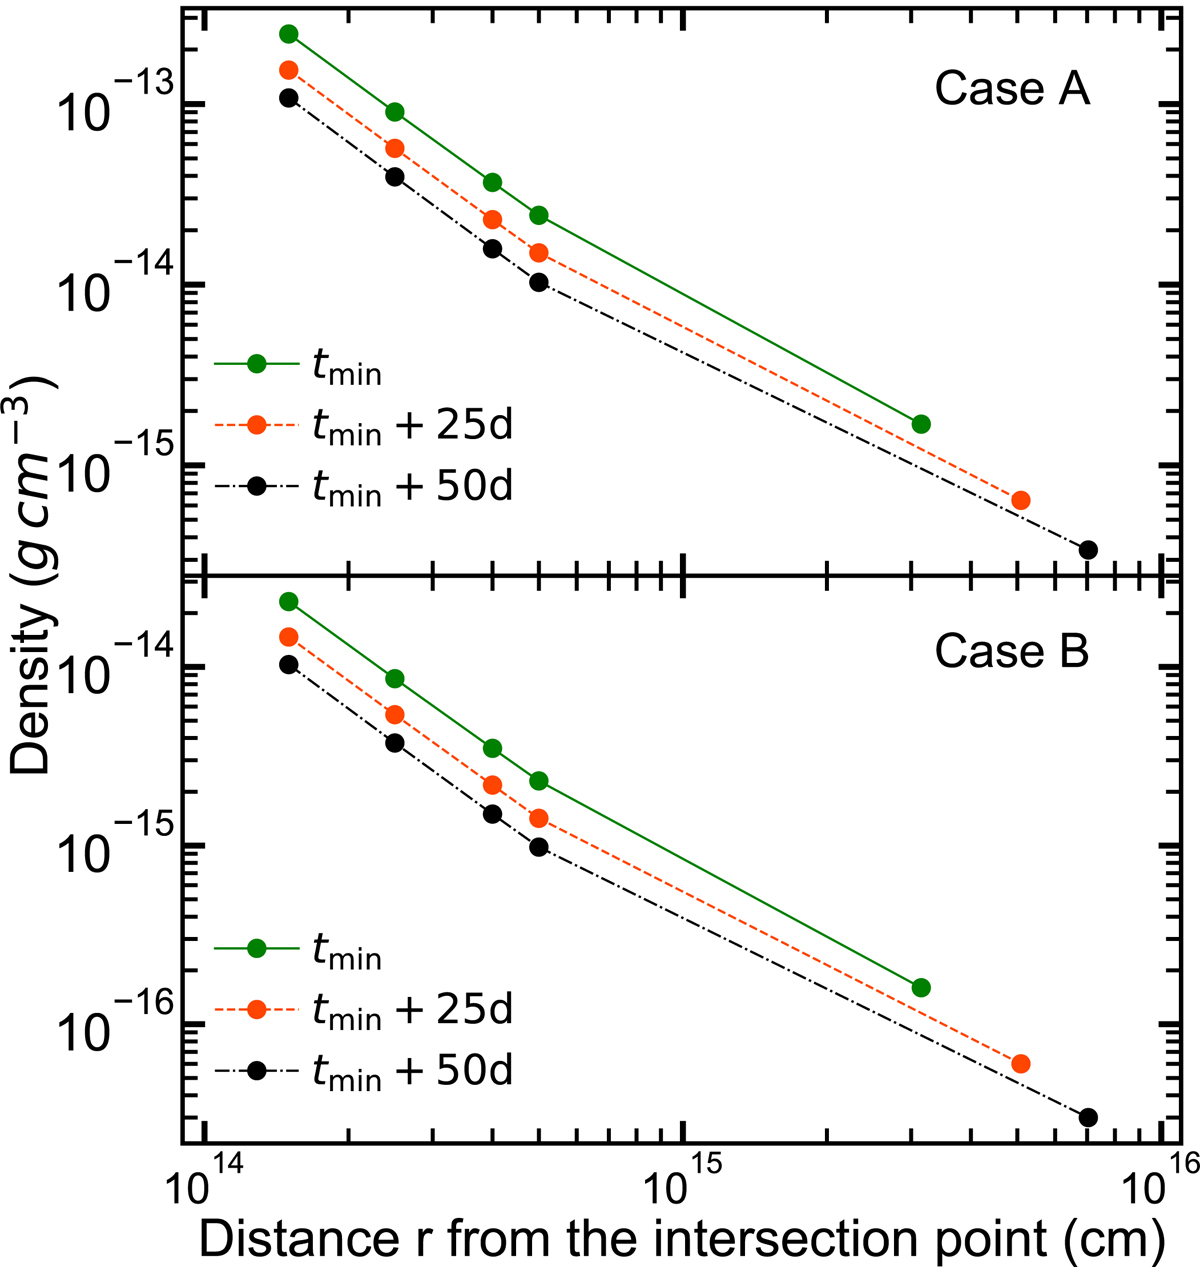
Fig. A.4.
Download original image
Indicative densities at various distances r from the intersection point, for the two different mass outflow rate cases (Case A top panel and Case B bottom panel) and for three different time snapshots (t = tmin, t = tmin + 25d and t = tmin + 50d). The outermost right point of every curve is where the Rmax is located, that is, the outer radius of the outflow/grid. The exact numbers shown in this plot can be found in Table B.1 in the Appendix.
Current usage metrics show cumulative count of Article Views (full-text article views including HTML views, PDF and ePub downloads, according to the available data) and Abstracts Views on Vision4Press platform.
Data correspond to usage on the plateform after 2015. The current usage metrics is available 48-96 hours after online publication and is updated daily on week days.
Initial download of the metrics may take a while.