Fig. 10.
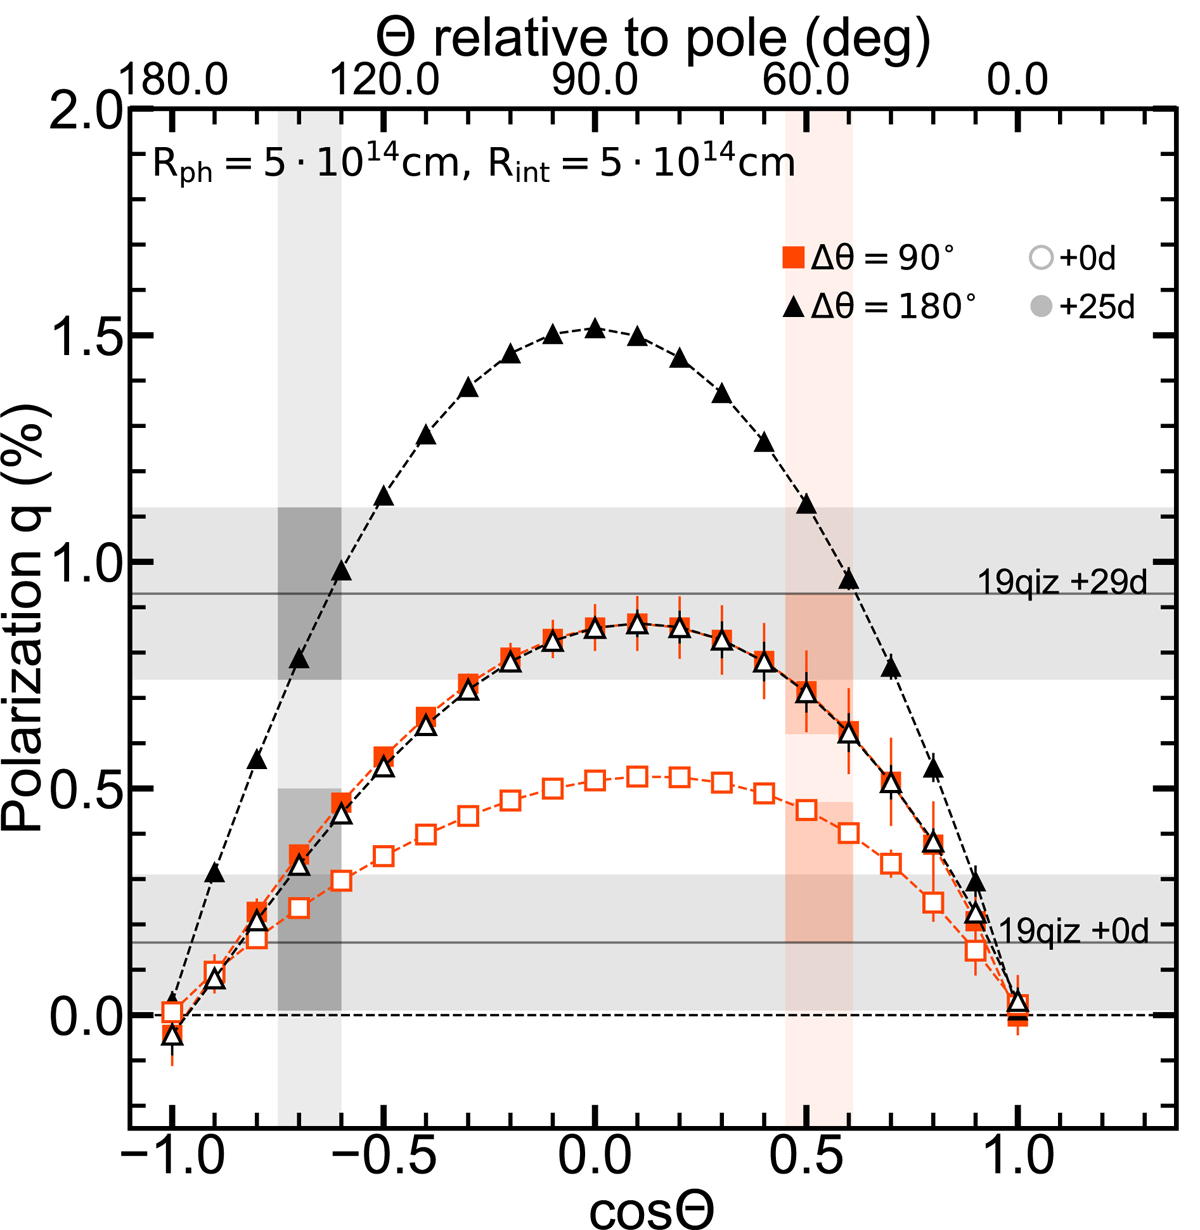
Download original image
Polarization q as a function of the viewing angle for two Case A simulations of Δθ = 90° and Δθ = 180° with Rph = 5 × 1014 cm and Rint = 5 × 1014 cm. The Ṁp of Case A (Ṁp = 2.93 M⊙ yr−1) is similar with the one that we calculate for AT 2019qiz (Ṁp = 2.79 M⊙ yr−1). Since there are polarimetric observations of AT 2019qiz at +0d and +29d with respect to peak (Patra et al. 2022), we present our aforementioned simulations at t = tmin and t = tmin + 25d in order to make a realistic comparison. The horizontal solid gray lines are the P values observed and the shaded area around it is the uncertainty of the measurements. The shaded vertical areas are potential viewing angles that can predict successfully the evolution of the polarization of the TDE. The more opaque regions of these shaded vertical areas are just a visual aid to guide the eye; they show where the simulated P values for the different time snapshots almost coincide with the observed P values, and their color matches the color of each simulation setup.
Current usage metrics show cumulative count of Article Views (full-text article views including HTML views, PDF and ePub downloads, according to the available data) and Abstracts Views on Vision4Press platform.
Data correspond to usage on the plateform after 2015. The current usage metrics is available 48-96 hours after online publication and is updated daily on week days.
Initial download of the metrics may take a while.