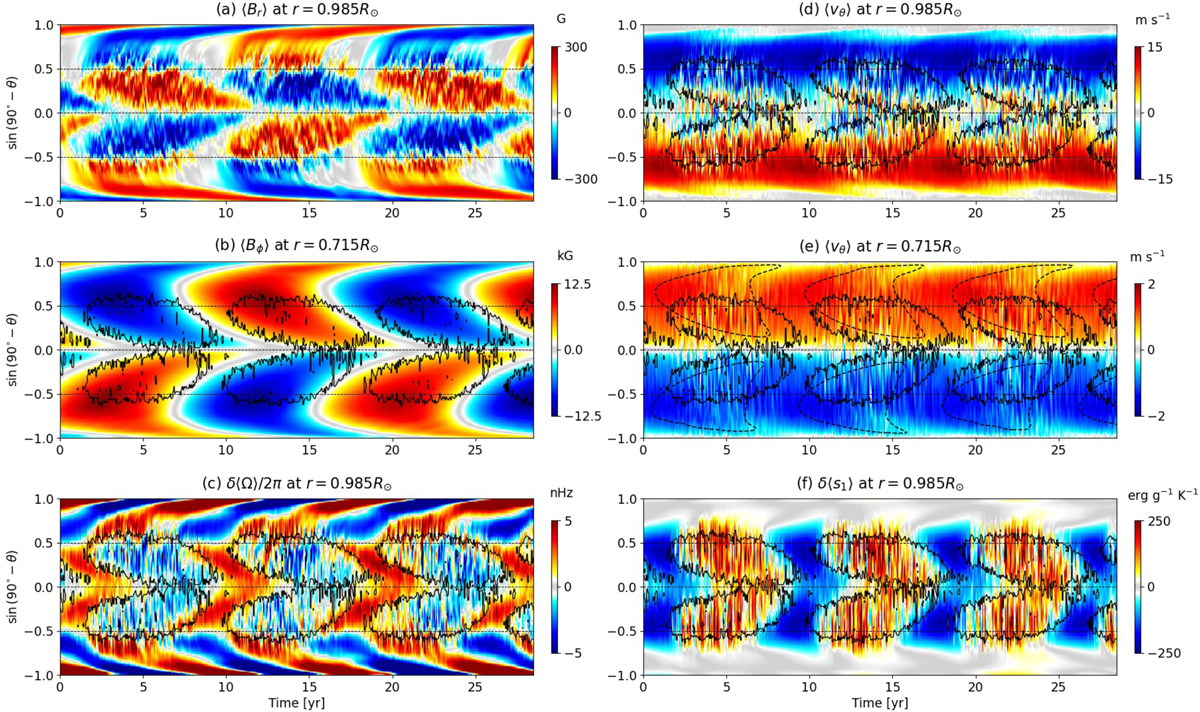
Fig. 9.
Download original image
Temporal evolution of the longitudinally-averaged magnetic fields and horizontal velocities. (a) Azimuthal mean of the radial field ⟨Br⟩ at the surface r = 0.985 R⊙. (b) Azimuthal mean of the longitudinal field ⟨Bϕ⟩ near the base of the convection zone r = 0.715 R⊙. Black solid lines are the contours of the emerged BMRs at each time. (c) Torsional oscillation pattern δ⟨Ω⟩=⟨Ω⟩−⟨Ω⟩t at the surface where ⟨⟩t denotes the azimuthal and temporal average. (d) Azimuthal mean of the latitudinal velocity ⟨vθ⟩ at the surface. Red (blue) in the northern hemisphere represents the equatorward (poleward) flow. (e) The same as (d) but near the base of the convection zone. Black dashed lines denote the contours of the toroidal field at the base (8.5 kG). (f) Entropy perturbation δ⟨s1⟩=⟨s1⟩−⟨s1⟩t at the surface.
Current usage metrics show cumulative count of Article Views (full-text article views including HTML views, PDF and ePub downloads, according to the available data) and Abstracts Views on Vision4Press platform.
Data correspond to usage on the plateform after 2015. The current usage metrics is available 48-96 hours after online publication and is updated daily on week days.
Initial download of the metrics may take a while.