Fig. 2.
Download original image
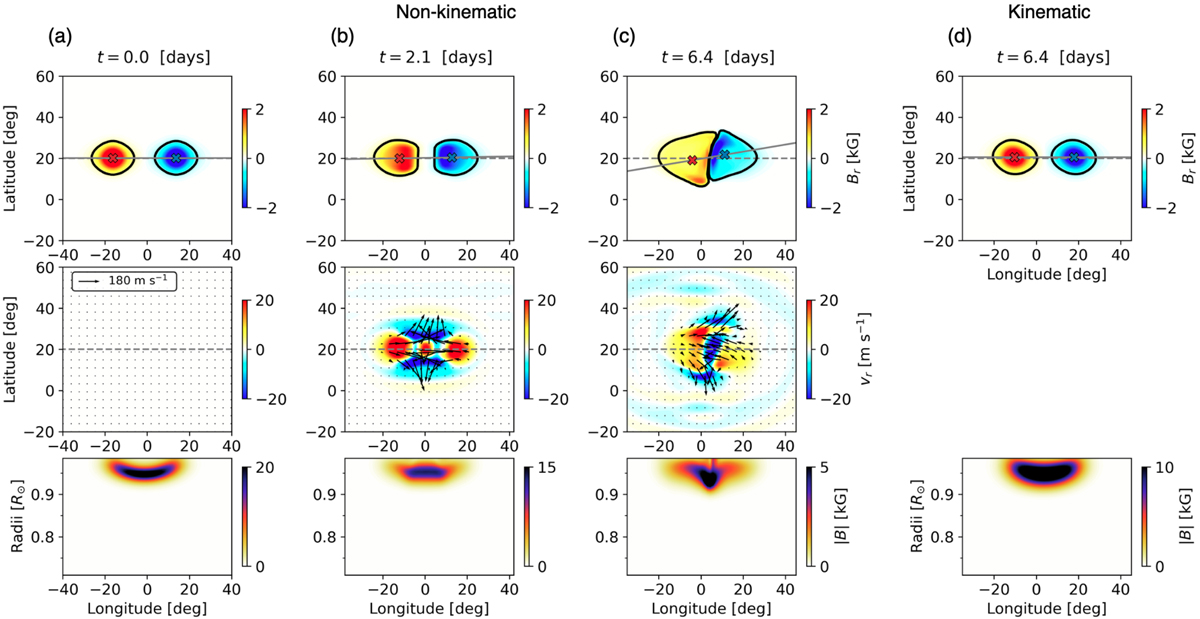
Temporal evolution of a BMR from case 1 at selected temporal points (a) t = 0 days, (b) t = 2.1 days, and (c) t = 6.4 days. The kinematic simulation with the same initial condition is shown in panel (d) at t = 6.4 days. Top panels show the radial field Br at the surface r = 0.985 R⊙. Thick black solid curves show the contours at |Br| = 0.3 kG. The blue and red cross marks represent the locations of the flux-weighted center for the leading and following spots, and the grey straight lines are drawn to connect these two cross marks. Middle panels show the radial flows, vr, near the surface, r = 0.98 R⊙, by colored contour and the horizontal velocities (vθ, vϕ) at the surface by vector arrows. Bottom panels show cross sections of the magnetic field strength |B| at the fixed latitude of 20°, denoted by black dashed lines in the top and middle panels.
Current usage metrics show cumulative count of Article Views (full-text article views including HTML views, PDF and ePub downloads, according to the available data) and Abstracts Views on Vision4Press platform.
Data correspond to usage on the plateform after 2015. The current usage metrics is available 48-96 hours after online publication and is updated daily on week days.
Initial download of the metrics may take a while.