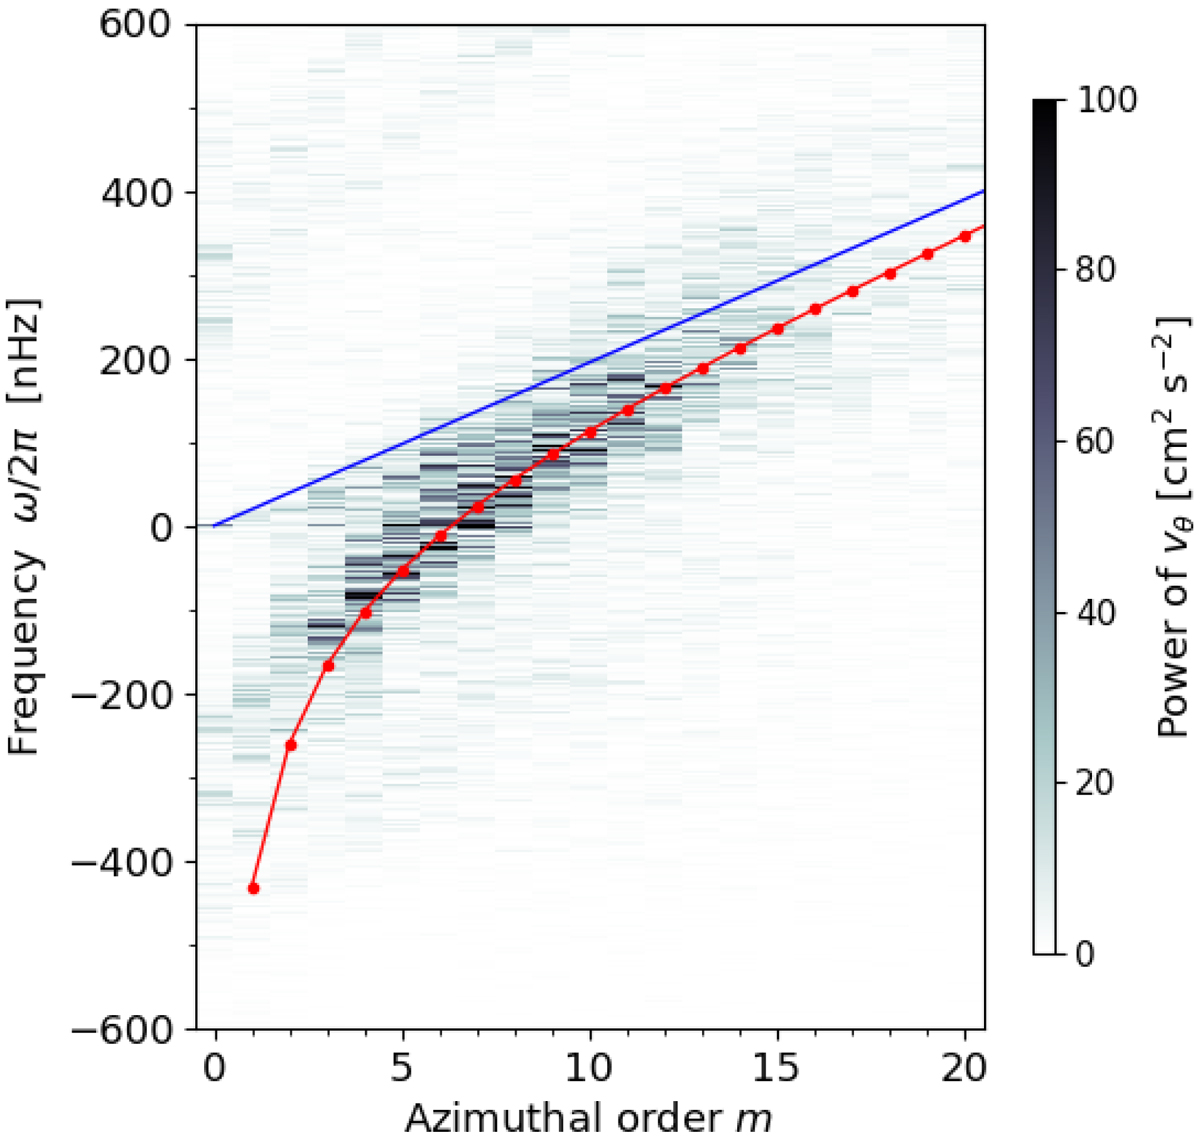
Fig. 13.
Download original image
Equatorial power spectrum of latitudinal velocity vθ near the surface r = 0.95 R⊙. The spectra are computed in a frame rotating at Ω0/2π = 431.3 nHz. The blue solid line represents the differential rotation rate at the surface ω = m(Ωsf − Ω0) where Ωsf = ⟨Ω(0.95 R⊙, π/2)⟩. The red points denote the theoretical dispersion relation of the sectoral Rossby modes, ω = −2Ωsf/(m + 1)+m(Ωsf − Ω0).
Current usage metrics show cumulative count of Article Views (full-text article views including HTML views, PDF and ePub downloads, according to the available data) and Abstracts Views on Vision4Press platform.
Data correspond to usage on the plateform after 2015. The current usage metrics is available 48-96 hours after online publication and is updated daily on week days.
Initial download of the metrics may take a while.