Fig. 11.
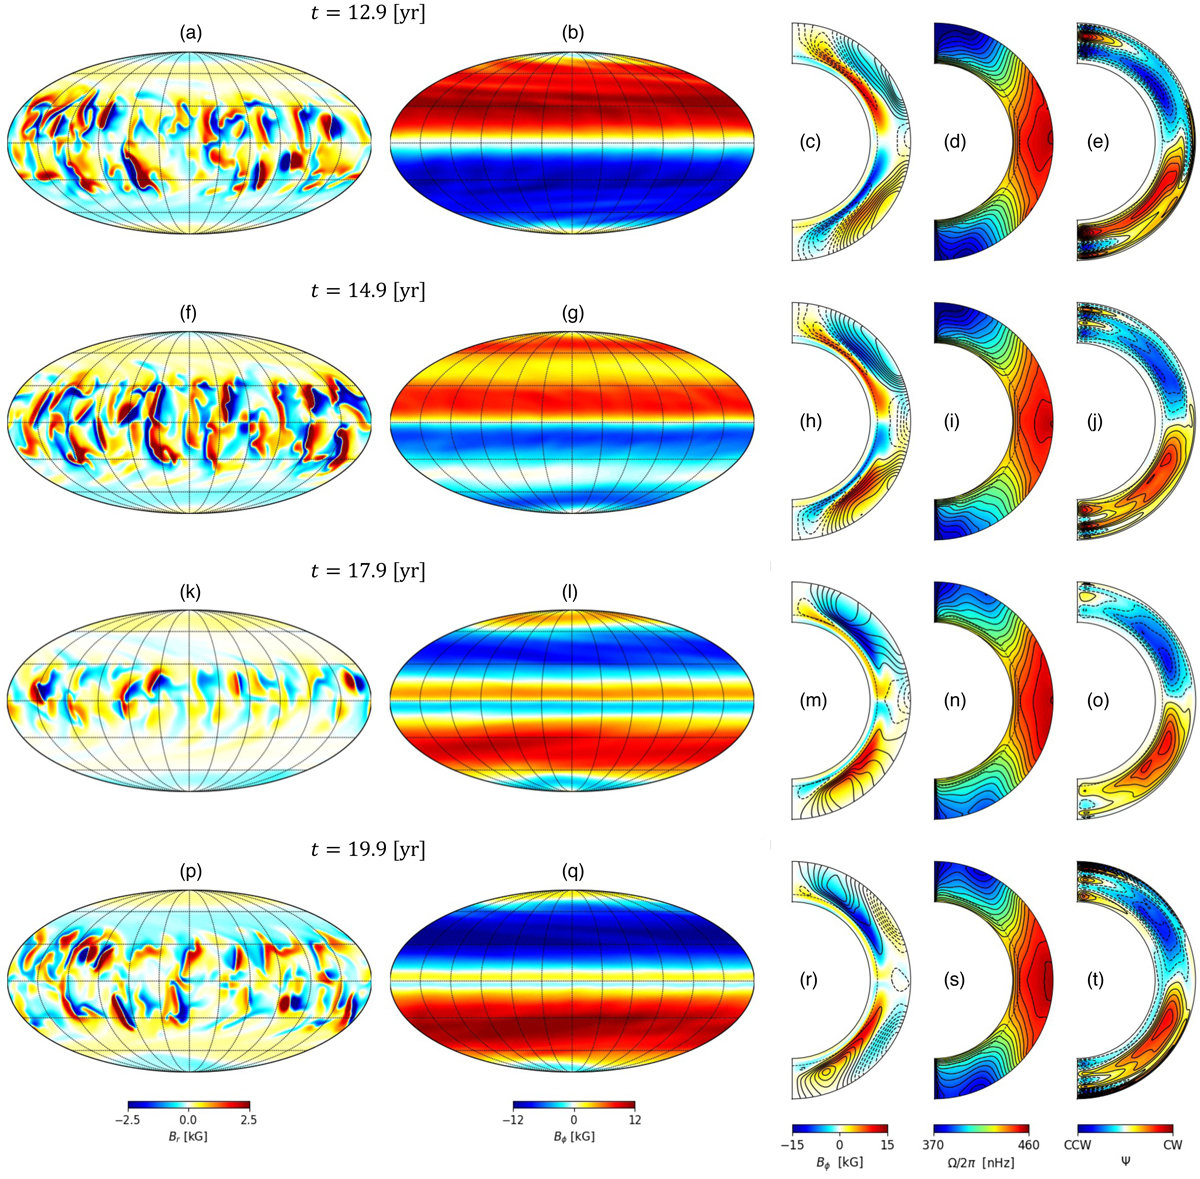
Download original image
Time evolution of magnetic field and velocity. Shown are the snapshots at t = 12.9 yr (from (a) to (e)), t = 14.9 yr (from (f) to (j)), t = 17.9 yr (from (k) to (o)), t = 19.9 yr (from (p) to (t)) in Fig. 9. The mollweide projections in the first and second columns show the radial field Br at the surface r = 0.985 R⊙ and longitudinal field Bϕ near the base of the convection zone r = 0.715 R⊙, respectively. The meridional plot in the third column represents the mean toroidal field (color scales) and poloidal field (contours). The meridional plots in the fourth and fifth columns represent the mean differential rotation and streamfunction of the meridional circulation, respectively. An animation of this figure is available online.
Current usage metrics show cumulative count of Article Views (full-text article views including HTML views, PDF and ePub downloads, according to the available data) and Abstracts Views on Vision4Press platform.
Data correspond to usage on the plateform after 2015. The current usage metrics is available 48-96 hours after online publication and is updated daily on week days.
Initial download of the metrics may take a while.