Fig. 9.
Download original image
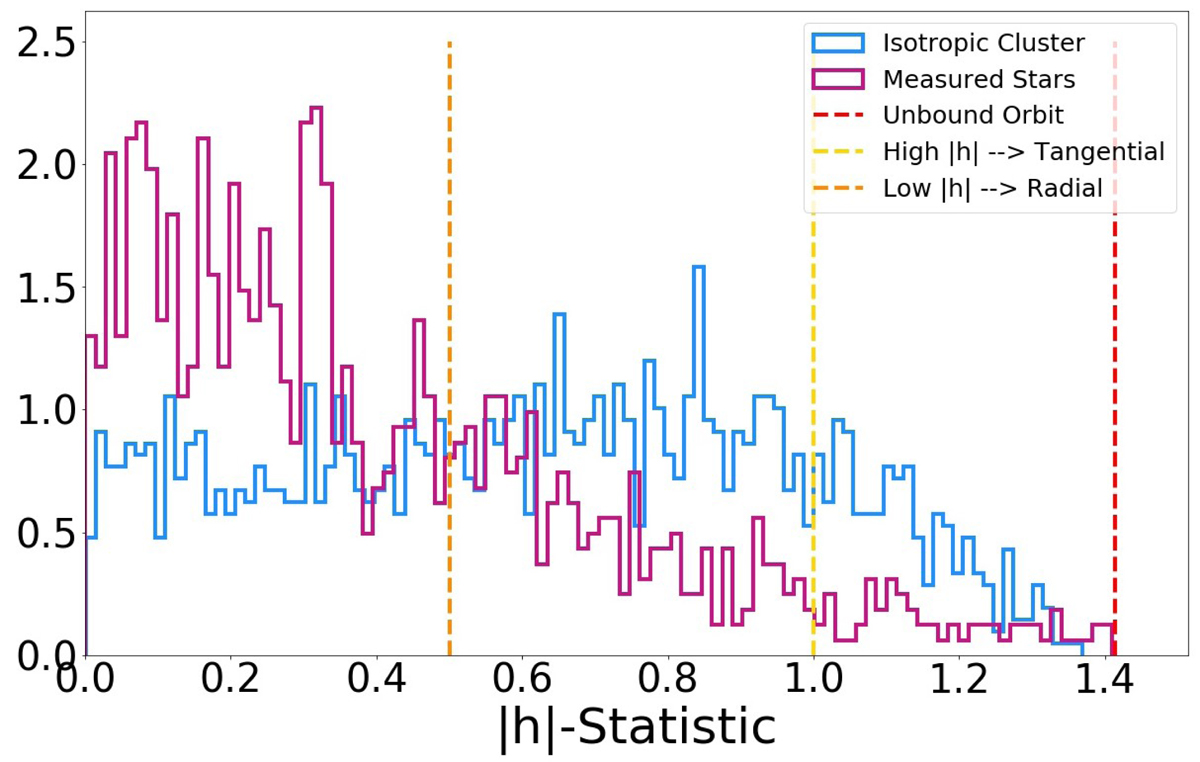
Number of stars binned as a function of the calculated |h| statistic for both the isotropic cluster (blue) and observed stars (magenta). The vertical lines in this case indicate high |h| values corresponding to tangential orbits (yellow), low |h| values corresponding to radial orbits (orange), and unbound orbits (red). This indicates that radial orbits (or low |h| values) are more common within the sample than orbits within the simulated isotropic cluster. Again, to best model observations, all members of the isotropic cluster with separations of < 2 arcsec from Sgr A* are discarded before plotting.
Current usage metrics show cumulative count of Article Views (full-text article views including HTML views, PDF and ePub downloads, according to the available data) and Abstracts Views on Vision4Press platform.
Data correspond to usage on the plateform after 2015. The current usage metrics is available 48-96 hours after online publication and is updated daily on week days.
Initial download of the metrics may take a while.