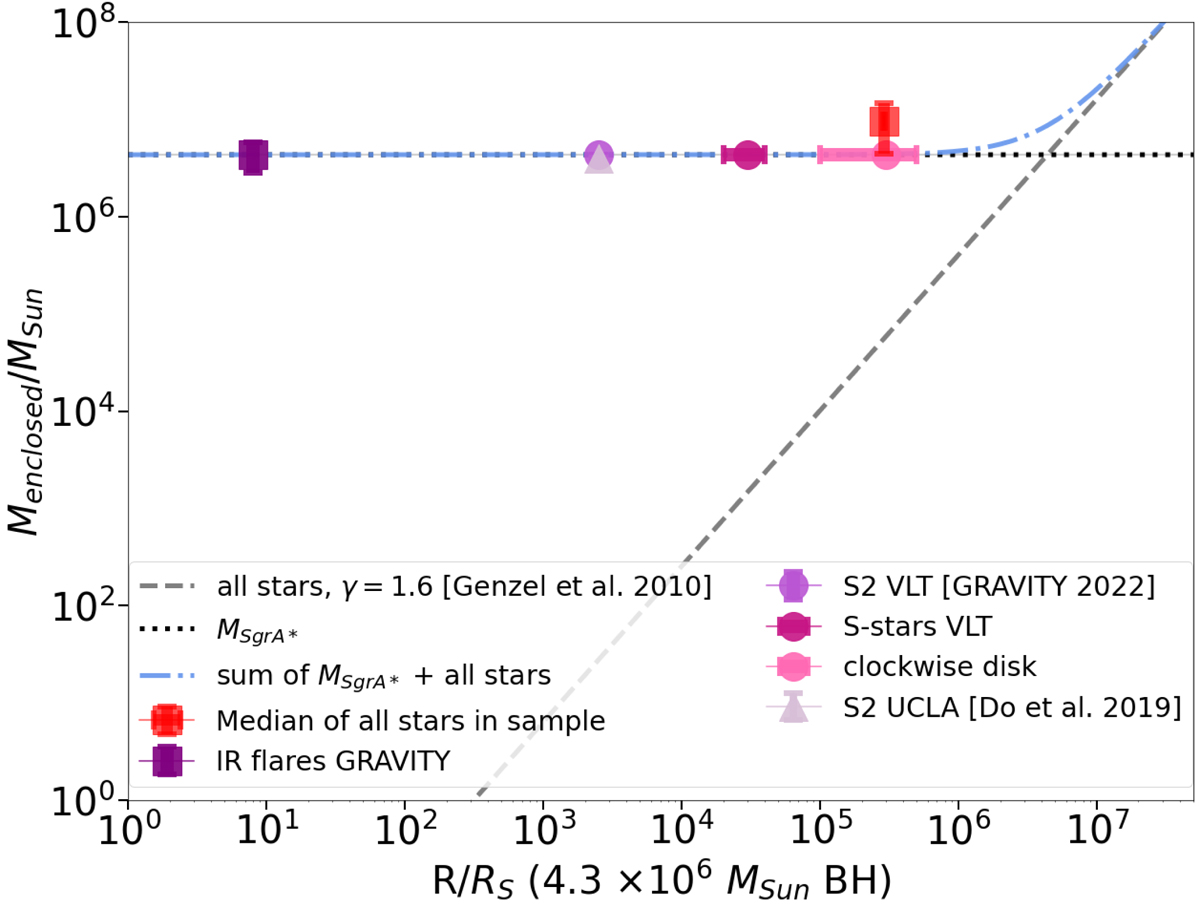
Fig. 7.
Download original image
Distribution of mass contained within the orbits of various sources. The median of the stars that have orbital solutions consistent with disk features in this work is shown by the red square marker. In this case, since the z values used are derived from the disk priors and we did not marginalize over priors, no formal error estimates for individual points can be provided. However, the uncertainty for the median of all the points in this work is estimated as the spread of the individual points. Also included are the values from the flare data (GRAVITY Collaboration 2018b), S2 from both Do et al. (2019) and GRAVITY Collaboration (2022), multiple S stars as measured with the VLT (GRAVITY Collaboration 2022), and stars that are members of the clockwise disk (GRAVITY Collaboration 2022). In this work, the enclosed mass is consistent within errors with the clockwise disk value, meaning no additional mass is required to account for the mass contained in the orbits of these stars. The blue line shows the sum of MSgr A* and the extended stellar mass distribution from previous works (e.g., Ghez et al. 2008; Gillessen et al. 2009; Genzel et al. 2010; Alexander 2017; Schödel et al. 2018; Baumgardt et al. 2018; GRAVITY Collaboration 2022).
Current usage metrics show cumulative count of Article Views (full-text article views including HTML views, PDF and ePub downloads, according to the available data) and Abstracts Views on Vision4Press platform.
Data correspond to usage on the plateform after 2015. The current usage metrics is available 48-96 hours after online publication and is updated daily on week days.
Initial download of the metrics may take a while.