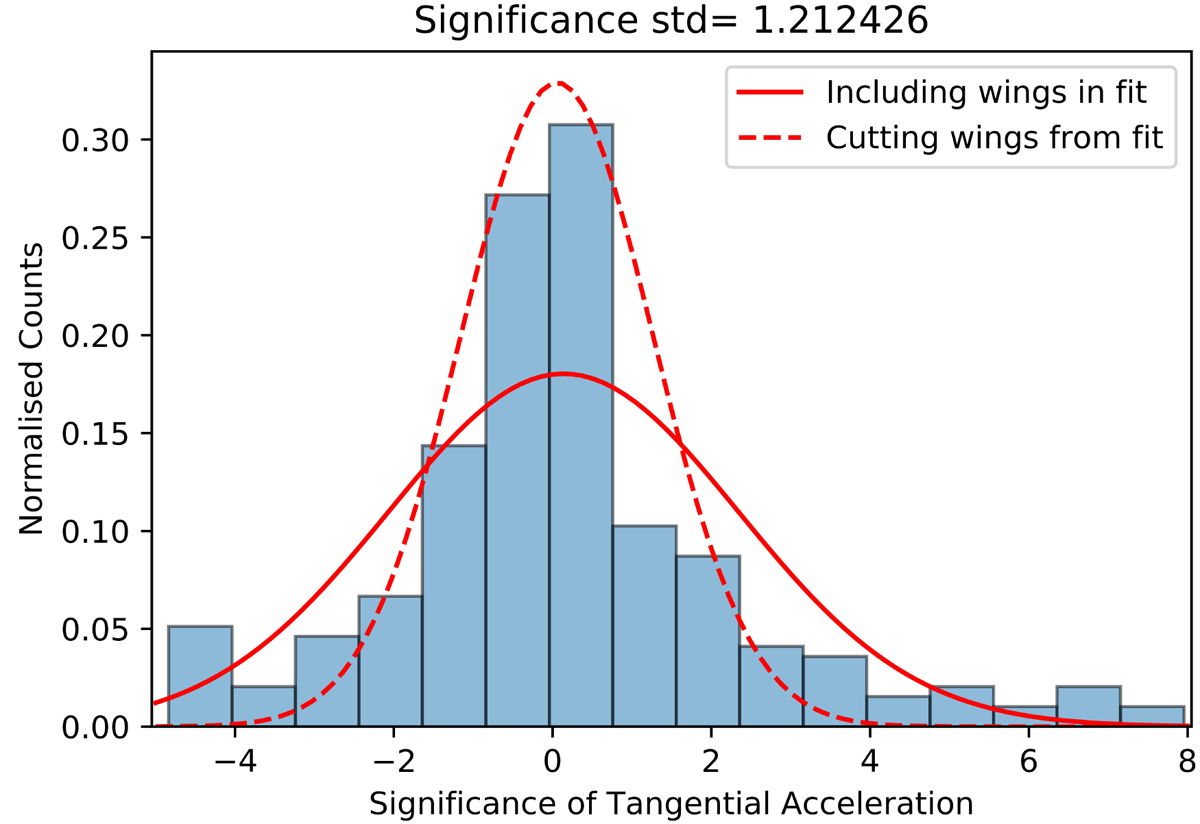
Fig. 2.
Download original image
Histogram illustrating the distribution of tangential acceleration significance within the sample of stars examined. The histogram is normalized such that the area under the curve is equal to 1. The tangential significance for each star is calculated from Eq. (2). Two Gaussian fits to the histogram are plotted. The first includes the wings of the histogram when finding a best fit (solid curve) that is dominated by sources with nonphysical accelerations, while the second excludes the data located in the wings of the histogram (dashed curve). Therefore, the standard deviation for the curve, which excludes the wings, was calculated and used to normalize the radial acceleration significance. In this case, the standard deviation is found to be ∼1.212.
Current usage metrics show cumulative count of Article Views (full-text article views including HTML views, PDF and ePub downloads, according to the available data) and Abstracts Views on Vision4Press platform.
Data correspond to usage on the plateform after 2015. The current usage metrics is available 48-96 hours after online publication and is updated daily on week days.
Initial download of the metrics may take a while.