Fig. 9.
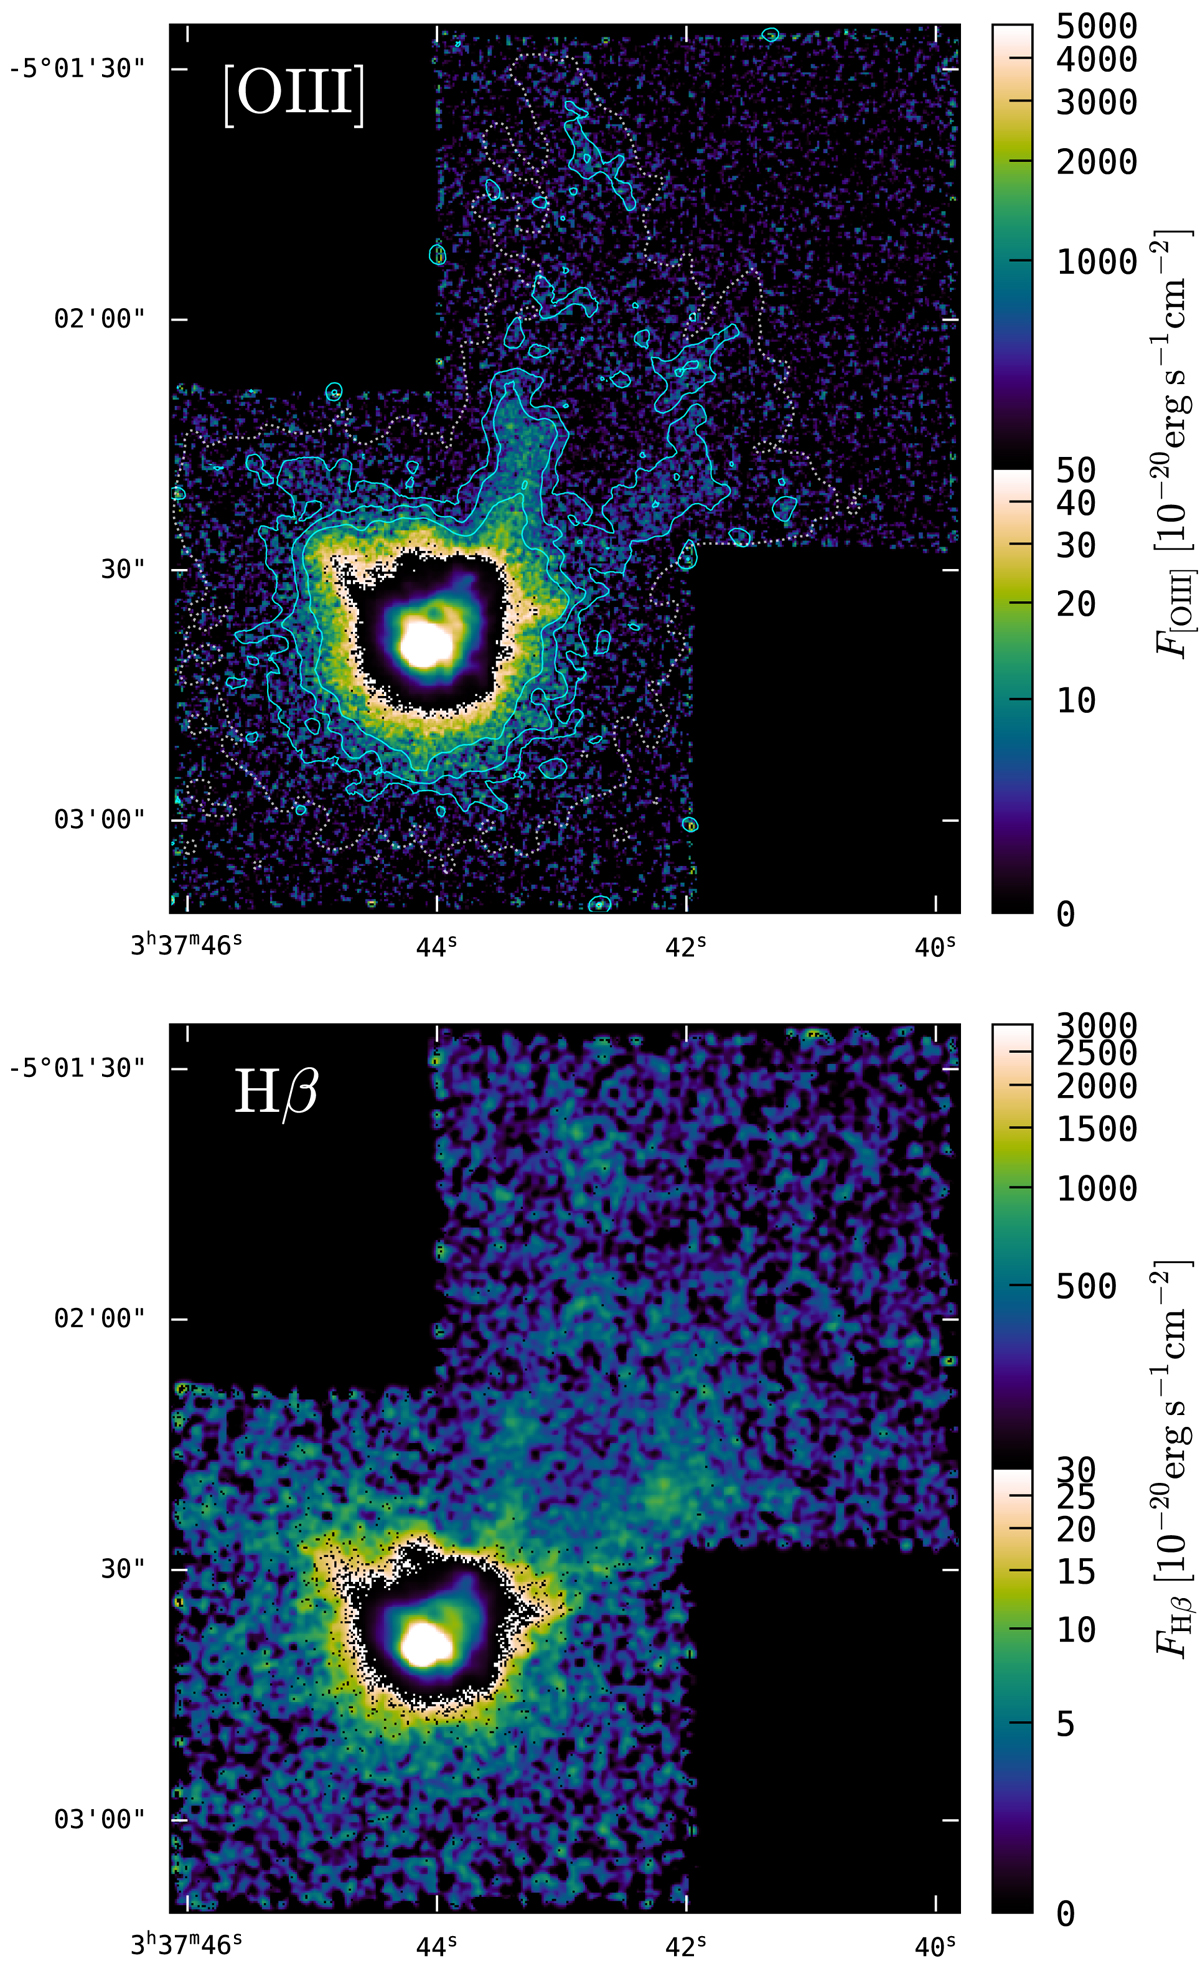
Download original image
Top panel: continuum subtracted [O III] λ5007 narrowband; contours indicate SB[OIII] = {5, 12.5, 25}×10−19 erg s−1 cm−2 arcsec−2. The cyclic colour map encodes flux densities from 0 to 5 × 10⁻¹⁹ erg s−1 cm−2 (colour bar) to 5 × 10⁻¹⁷ erg s−1 cm−2. The image has been smoothed with a Gaussian of 0.4″ FWHM. Bottom panel: continuum subtracted Hβ narrowband. The cyclic colour map encodes flux from 0 to 3 × 10⁻¹⁹ erg s−1 cm−2 to 3 × 10⁻¹⁷ erg s−1 cm−2. The image has been smoothed with a Gaussian of 0.95″ FWHM to enhance the visibility of the low-SB Hβ emission.
Current usage metrics show cumulative count of Article Views (full-text article views including HTML views, PDF and ePub downloads, according to the available data) and Abstracts Views on Vision4Press platform.
Data correspond to usage on the plateform after 2015. The current usage metrics is available 48-96 hours after online publication and is updated daily on week days.
Initial download of the metrics may take a while.