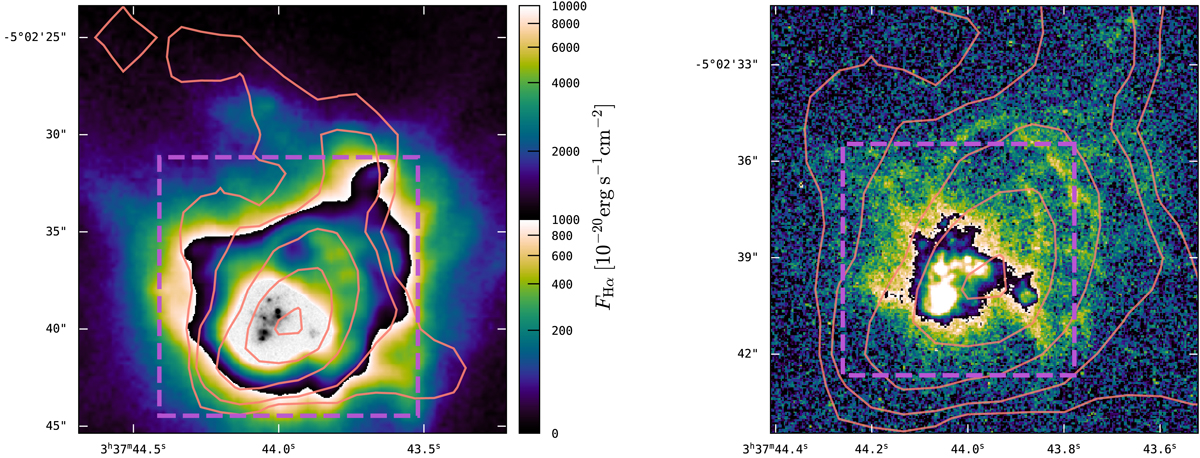
Fig. 4.
Download original image
Left panel: zoomed view (22″ × 22″/6 kpc × 6 kpc) of the Hα narrow band image from the top panel of Fig. 1 with NHI contours from the VLA B-configuration 21 cm observations (NHI = {5, 10, 20, 30, 40}×1020 cm−2, rose lines); these contours are also shown in Fig. 1 as subdued white lines. The cyclic colour map encodes Hα flux in a asinh-scale from 0 to 10−17 erg s−1 cm−2 to 10−15 erg s−1 cm−2. In the brightest central region the archival HST F550M image is inset, with an arbitrary asinh-scaling to highlight the compact super-star clusters that comprise the main stellar body of this system. The violet dashed square indicates the region that is displayed in the right panel. Right panel: inner high-SBHα region as seen in the archival HST FR656N image (13″ × 13″/3.5 kpc × 3.5 kpc) displayed here with a cyclic asinh-scale from 0 to 5 × 10⁻¹⁵ erg s−1 cm−2 to 1013 erg s−1 cm−2. Here the violet dashed square indicates the region that is displayed in Fig. 5.
Current usage metrics show cumulative count of Article Views (full-text article views including HTML views, PDF and ePub downloads, according to the available data) and Abstracts Views on Vision4Press platform.
Data correspond to usage on the plateform after 2015. The current usage metrics is available 48-96 hours after online publication and is updated daily on week days.
Initial download of the metrics may take a while.