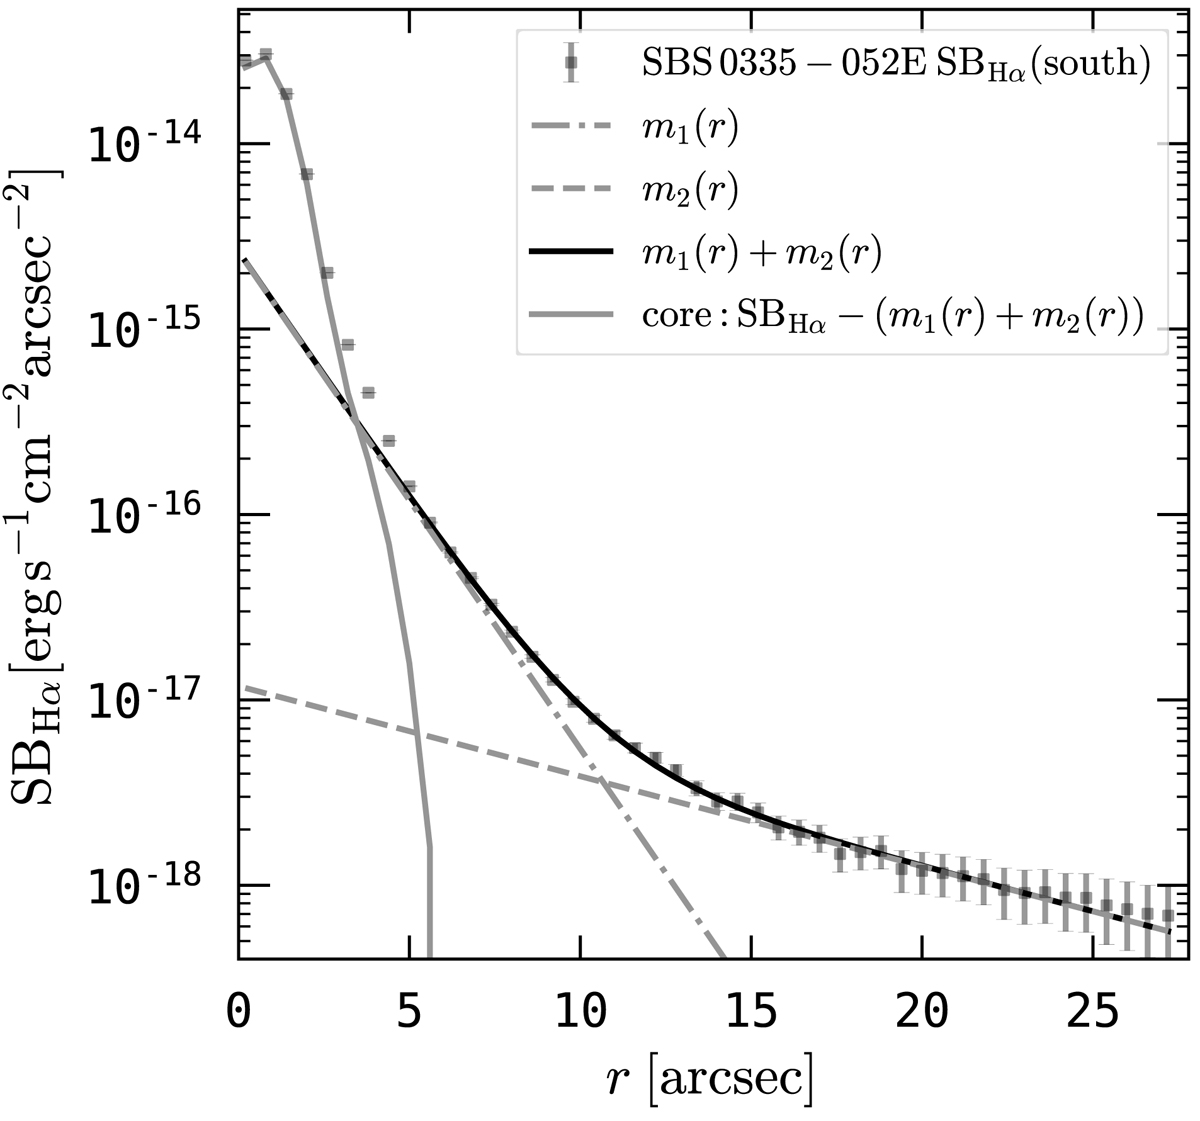
Fig. 3.
Download original image
Hα surface brightness profile in the south, i.e. not affected by the filaments in the north. The points show the observed profile in circular annuli and error-bars are 2σ. The black line indicates the double exponential profile fitted to the outer (r > 5″) profile, while dot-dashed and dashed lines indicate the individual components with scale-lengths r1 = 1.62″ (447 pc) and r2 = 8.94″ (2.47 kpc). The grey line indicates the light profile of the central (r ≤ 5″) residual component that is obtained after subtracting the double exponential.
Current usage metrics show cumulative count of Article Views (full-text article views including HTML views, PDF and ePub downloads, according to the available data) and Abstracts Views on Vision4Press platform.
Data correspond to usage on the plateform after 2015. The current usage metrics is available 48-96 hours after online publication and is updated daily on week days.
Initial download of the metrics may take a while.