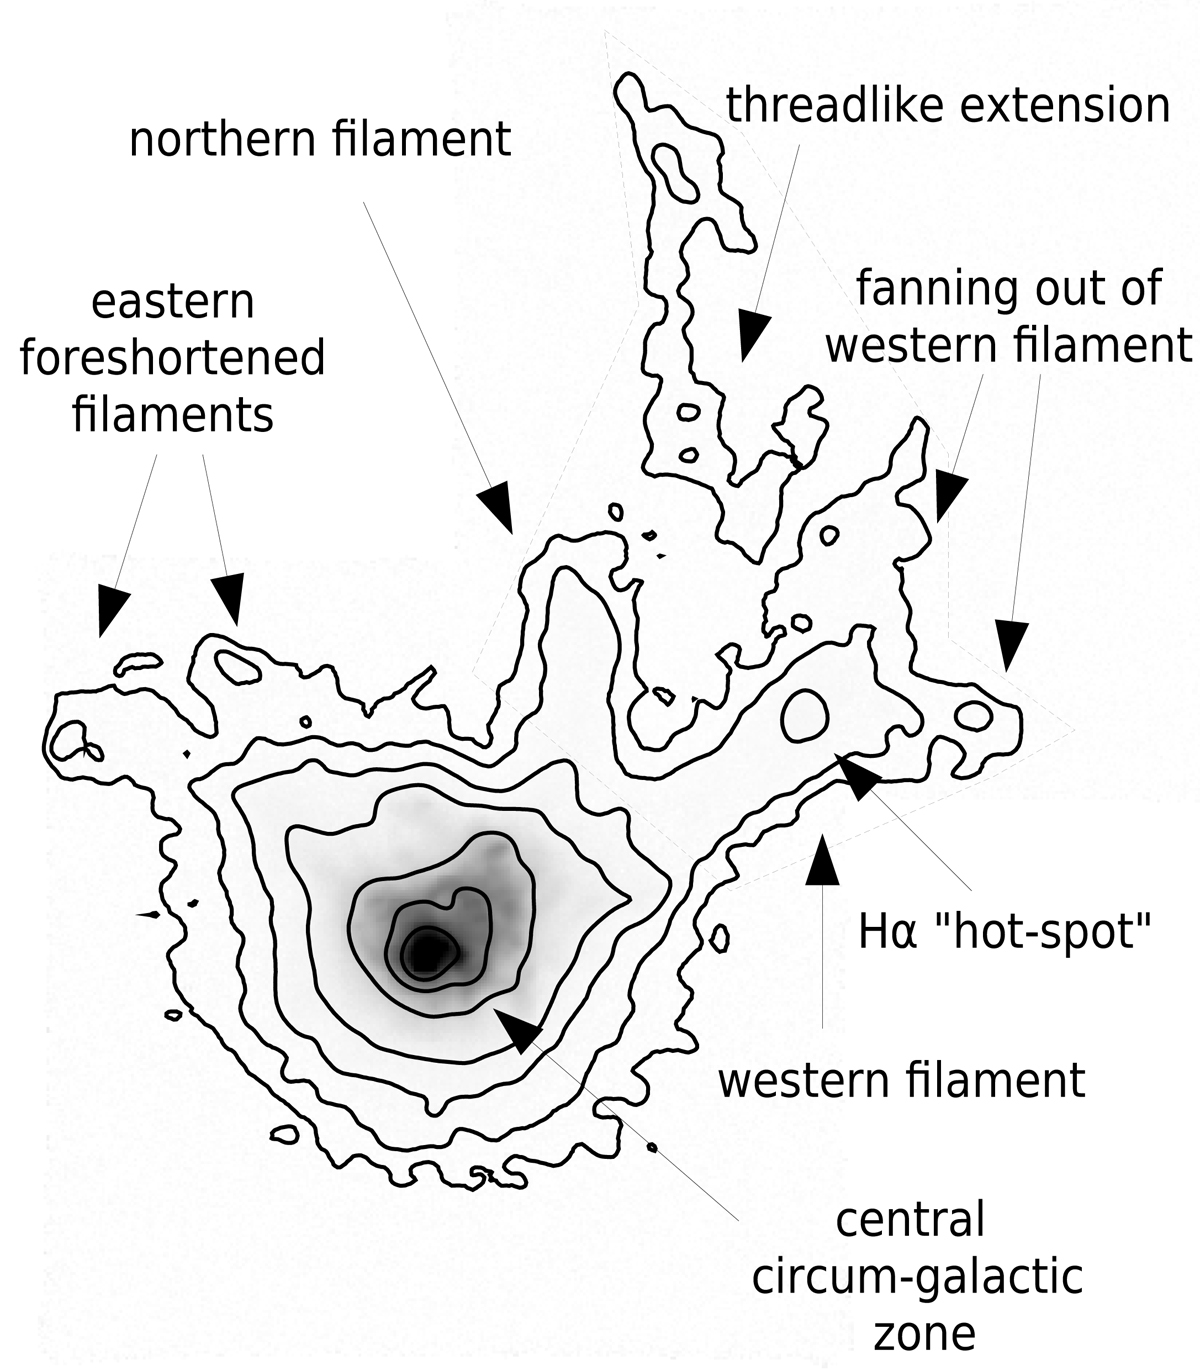
Fig. 2.
Download original image
Annotated Hα surface brightness contours (contour levels SBHα = {1.5, 2.5, 5, 12.5, 100, 700}×10−18 erg s−1 cm−2 arcsec−2). In the background the Hα narrowband is shown with a log-stretch to 5 × 10⁻¹⁶ erg s−1 cm−2. The thin-dotted line surrounding the filaments to the north-west demarcates the aperture that is used to estimate the total Hα flux from that structure (Sect. 4).
Current usage metrics show cumulative count of Article Views (full-text article views including HTML views, PDF and ePub downloads, according to the available data) and Abstracts Views on Vision4Press platform.
Data correspond to usage on the plateform after 2015. The current usage metrics is available 48-96 hours after online publication and is updated daily on week days.
Initial download of the metrics may take a while.