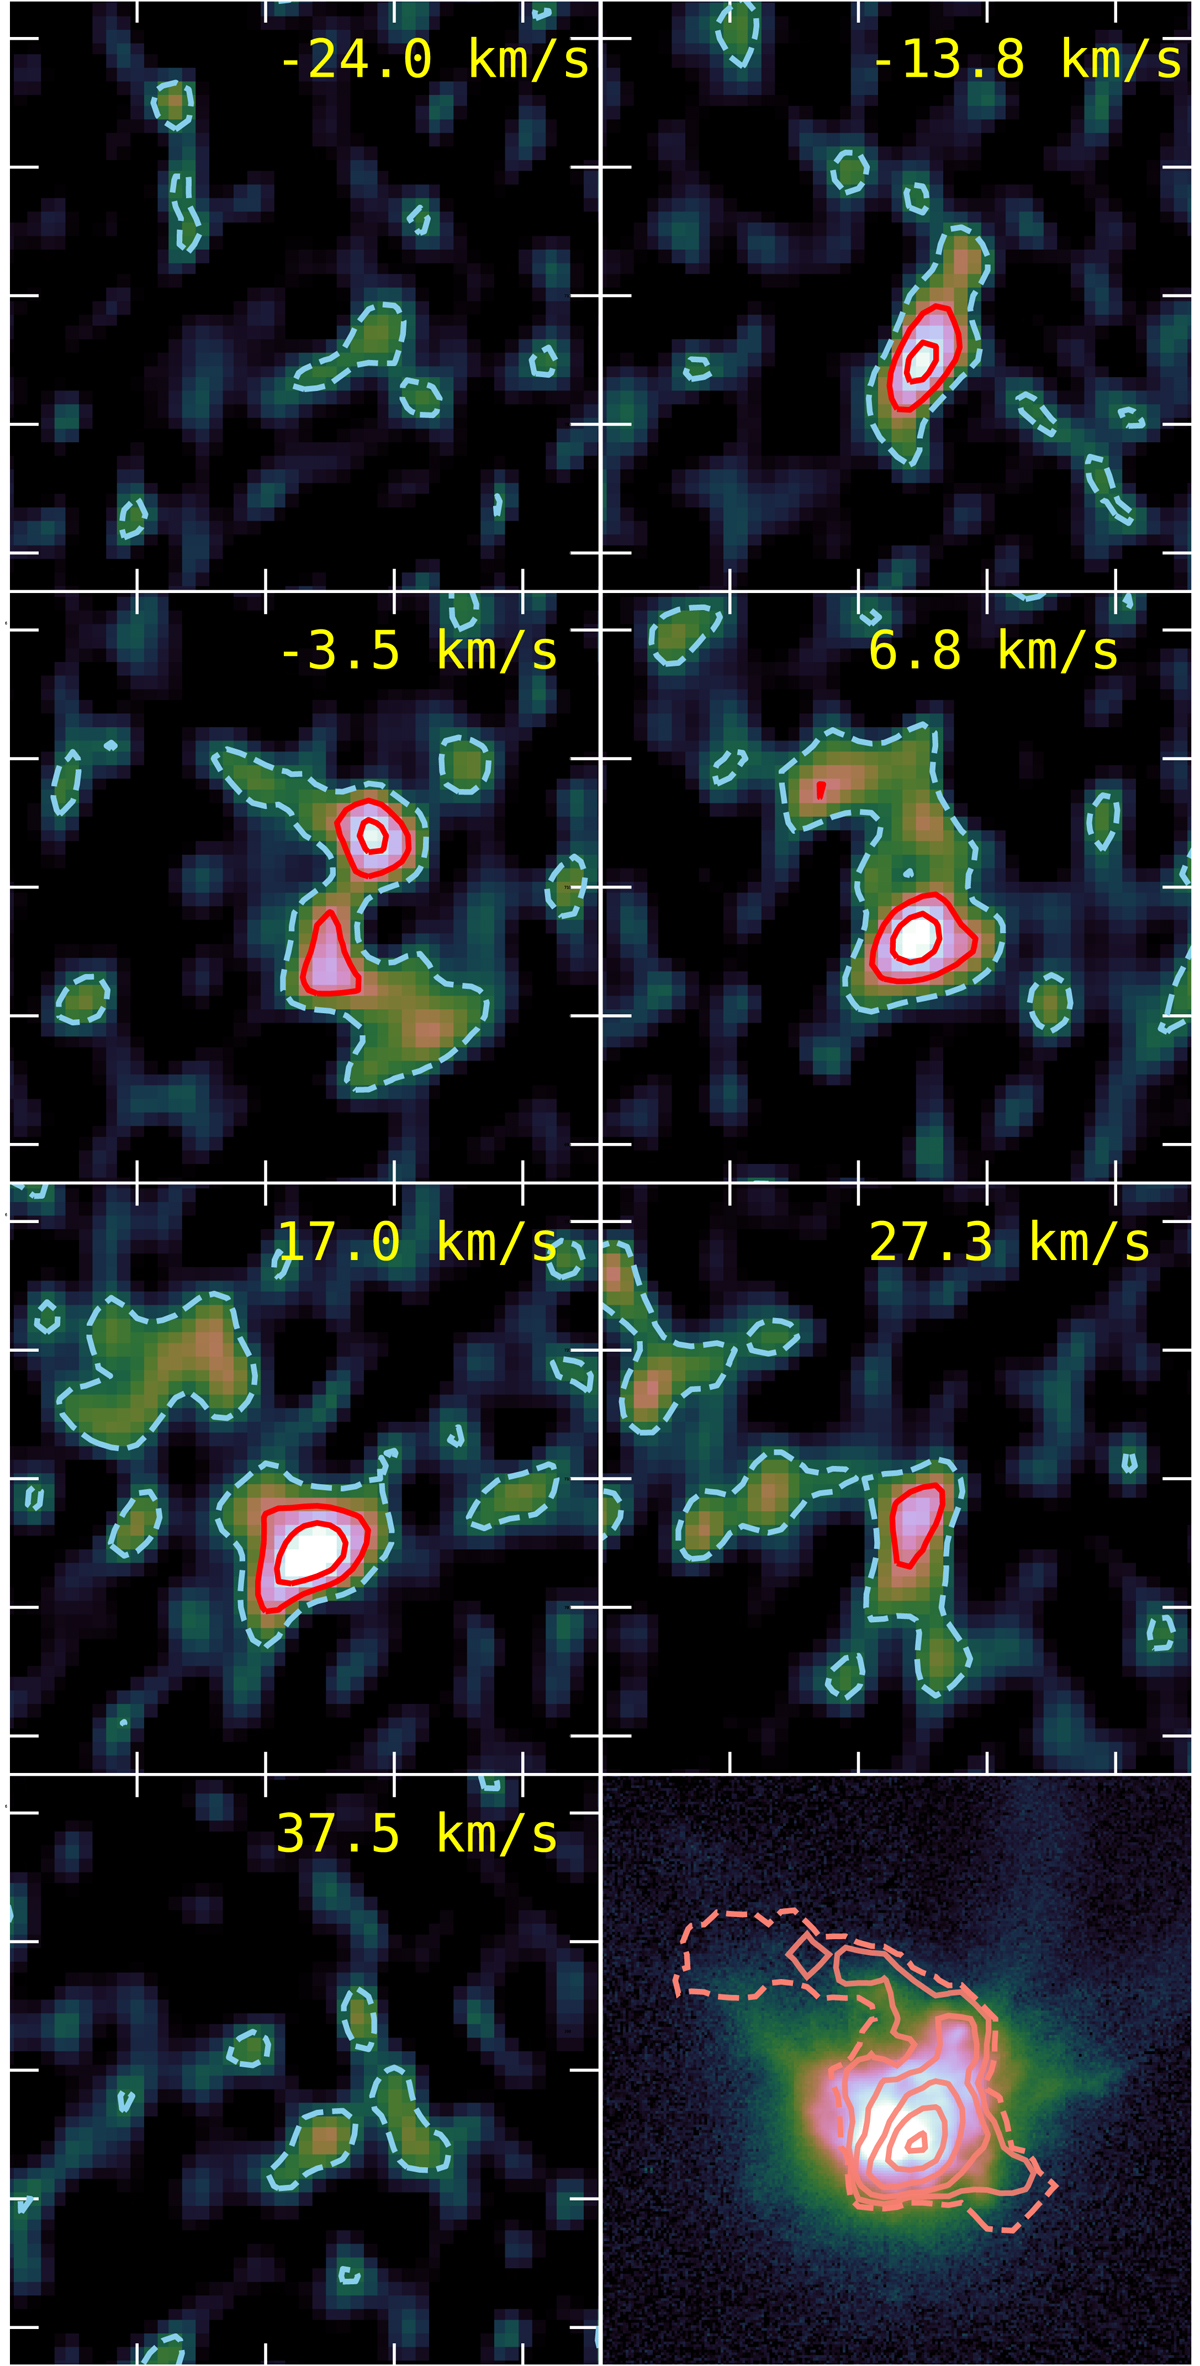
Fig. B.1.
Download original image
Channel maps from the untapered VLA-B configuration datacube. Each channel is shown with a linear stretch from 0 to 6σ, where σ = 2.5 × 10⁻⁴ Jy beam−1 is determined from fitting the negative distribution of pixels in each channel. Contours are drawn at 2σ (dashed), 4σ, and 6σ. The bottom right panel shows the same viewport (46″/12.7 kpc along each axis), but with the Hα NB image and the total NHI contours from Fig. 1.
Current usage metrics show cumulative count of Article Views (full-text article views including HTML views, PDF and ePub downloads, according to the available data) and Abstracts Views on Vision4Press platform.
Data correspond to usage on the plateform after 2015. The current usage metrics is available 48-96 hours after online publication and is updated daily on week days.
Initial download of the metrics may take a while.