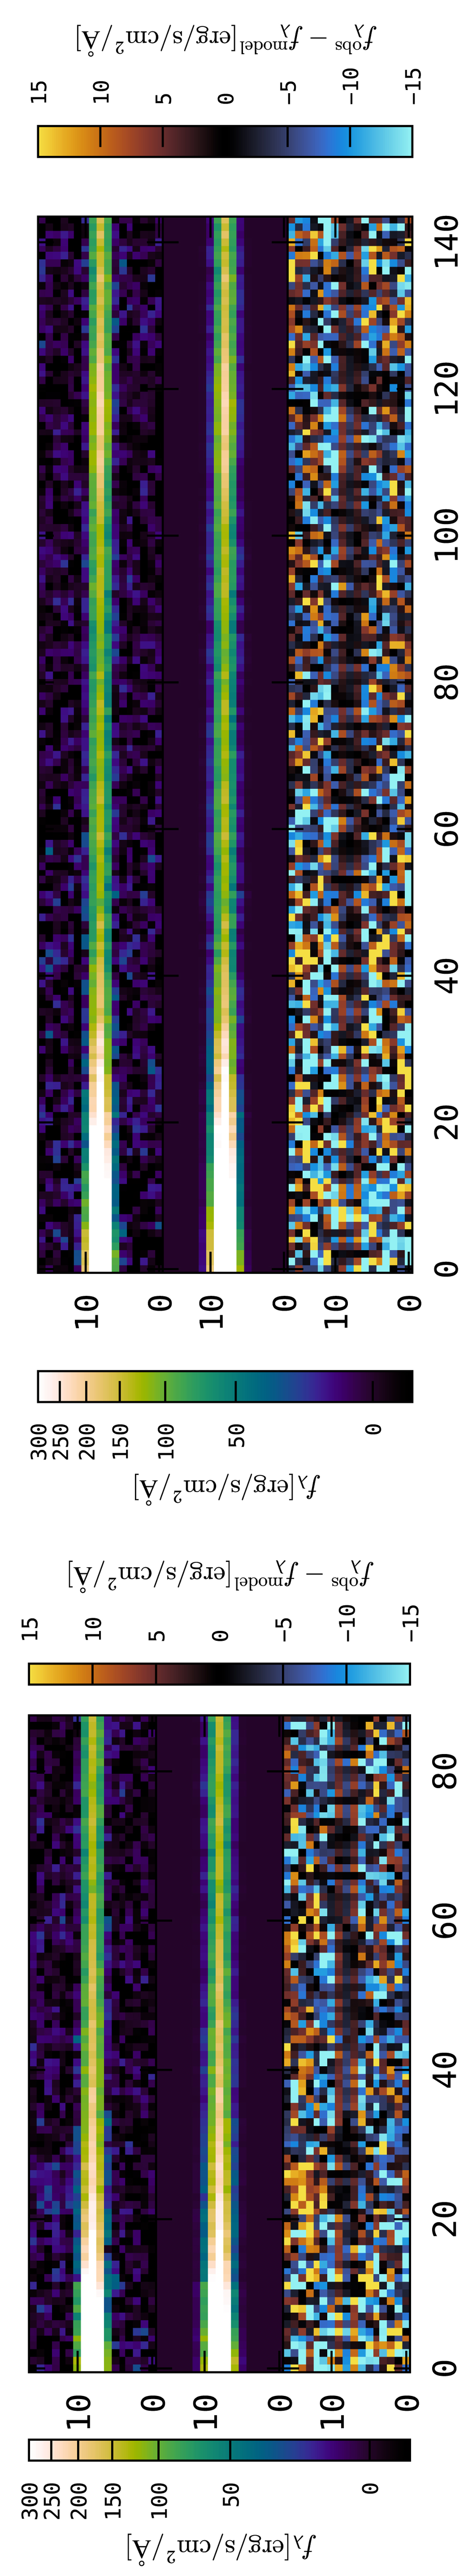
Fig. A.1.
Download original image
Hα emission line profiles extracted along the pseudo slits shown in the bottom left panel of Fig. 1 (top panels) alongside the fitted Gaussian models (centre panels) and the residuals (data – model, bottom panels). The left panels show the results for the eastern filament, whereas the right panels show the result for the western filament and the horizontal extend is the same as in Fig. 10. The x-axis is the cross dispersion axis in units of MUSE spaxels (1 spaxel = 0.2″) and the y-axis is the dispersion axis (1 pixel = 1.25 Å). The colour bar on the left corresponds to the two top panels, whereas the colour bar on the right corresponds to the bottom panel.
Current usage metrics show cumulative count of Article Views (full-text article views including HTML views, PDF and ePub downloads, according to the available data) and Abstracts Views on Vision4Press platform.
Data correspond to usage on the plateform after 2015. The current usage metrics is available 48-96 hours after online publication and is updated daily on week days.
Initial download of the metrics may take a while.