Fig. 16.
Download original image
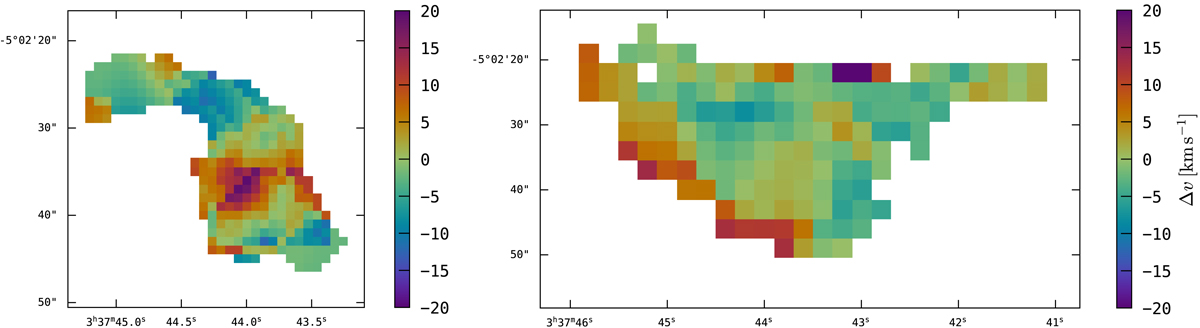
Maps showing ![]() , where vHI are the H I line-of-sight velocities and
, where vHI are the H I line-of-sight velocities and ![]() are the resolution matched and re-projected H II line-of-sight velocities. The left panel shows the comparison with the untapered VLA-B configuration data, i.e. the subtraction of the velocity field in the lower-right panel of Fig. 14 from the upper-left panel of Fig. 14, while the right panel shows the comparison for the 7 kλ-tapered data, i.e. the subtraction of the velocity field in the lower panel of Fig. 15 from the upper panel of Fig. 15.
are the resolution matched and re-projected H II line-of-sight velocities. The left panel shows the comparison with the untapered VLA-B configuration data, i.e. the subtraction of the velocity field in the lower-right panel of Fig. 14 from the upper-left panel of Fig. 14, while the right panel shows the comparison for the 7 kλ-tapered data, i.e. the subtraction of the velocity field in the lower panel of Fig. 15 from the upper panel of Fig. 15.
Current usage metrics show cumulative count of Article Views (full-text article views including HTML views, PDF and ePub downloads, according to the available data) and Abstracts Views on Vision4Press platform.
Data correspond to usage on the plateform after 2015. The current usage metrics is available 48-96 hours after online publication and is updated daily on week days.
Initial download of the metrics may take a while.