Fig. 15.
Download original image
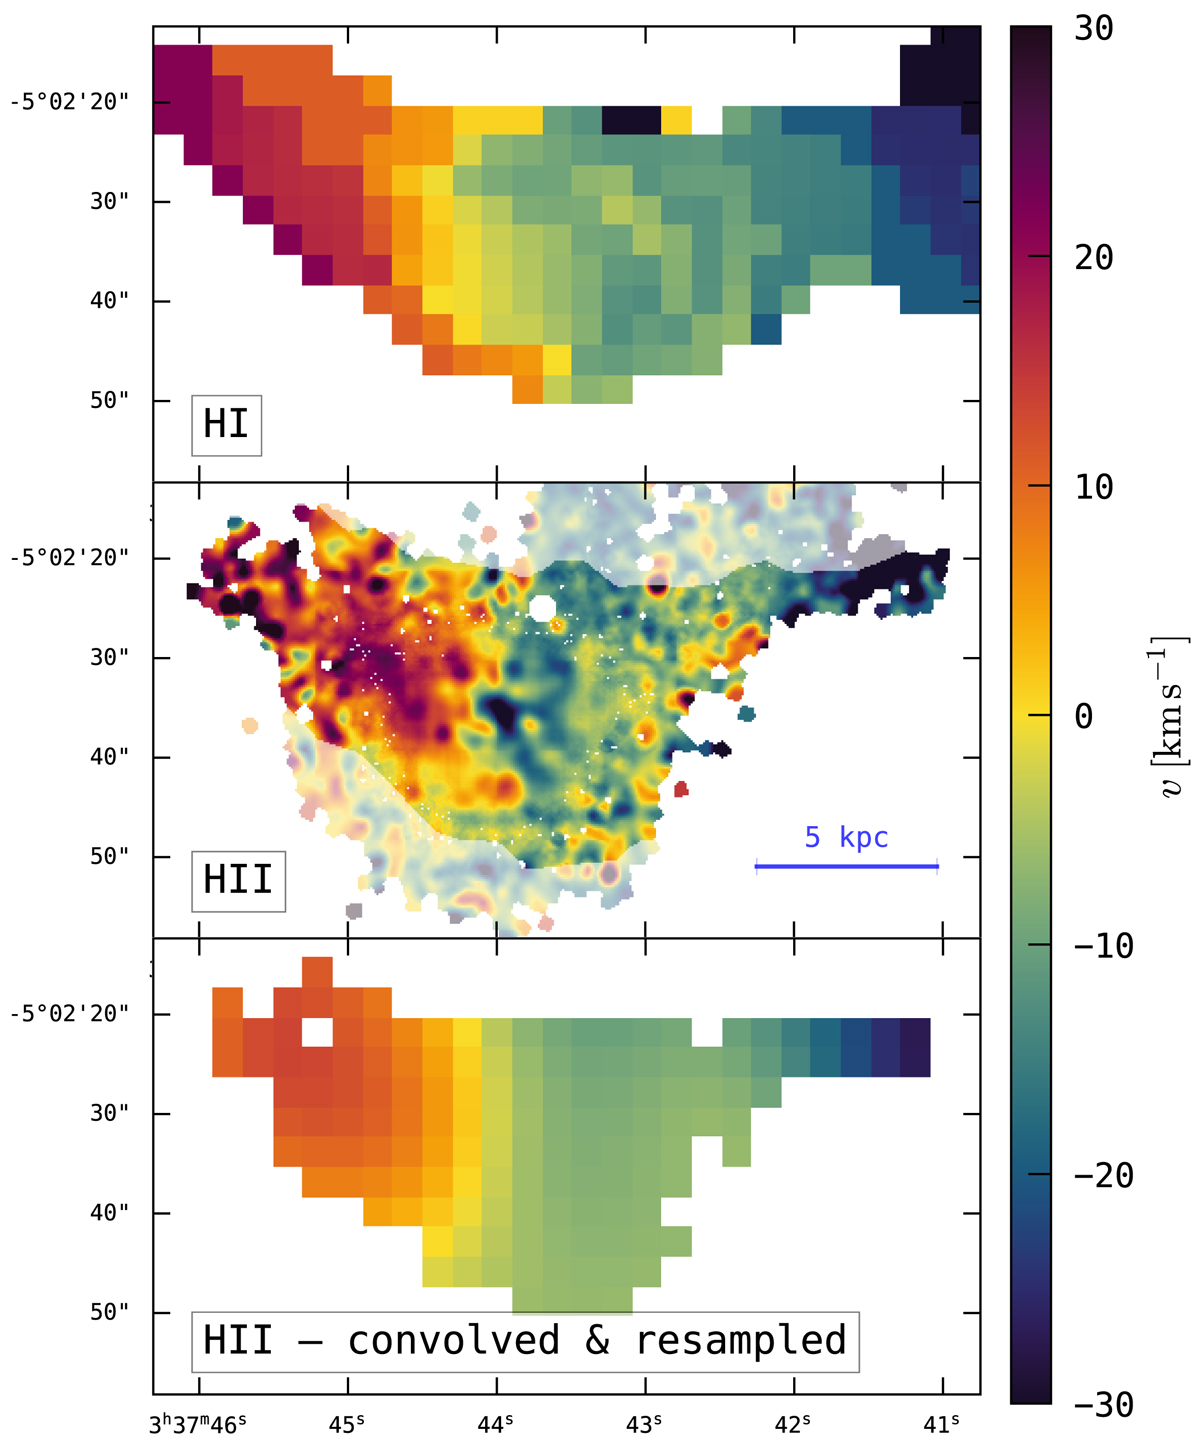
Comparison between H I and H II kinematics on larger scales; we here display a zoomed-in view of the 7 kλ tapered 21 cm data shown in the bottom panel of Fig. 13. The top panel shows the first moment from the H I data, the middle panel shows the ionised gas velocity field, with regions outside of H I detections being subdued, and the bottom panel shows the H II velocity field convolved with a 2D Gaussian (15.9″ × 14.7″, position angle 66.4°) to mimic the beam smearing and resampled onto the native grid of the H I observations.
Current usage metrics show cumulative count of Article Views (full-text article views including HTML views, PDF and ePub downloads, according to the available data) and Abstracts Views on Vision4Press platform.
Data correspond to usage on the plateform after 2015. The current usage metrics is available 48-96 hours after online publication and is updated daily on week days.
Initial download of the metrics may take a while.