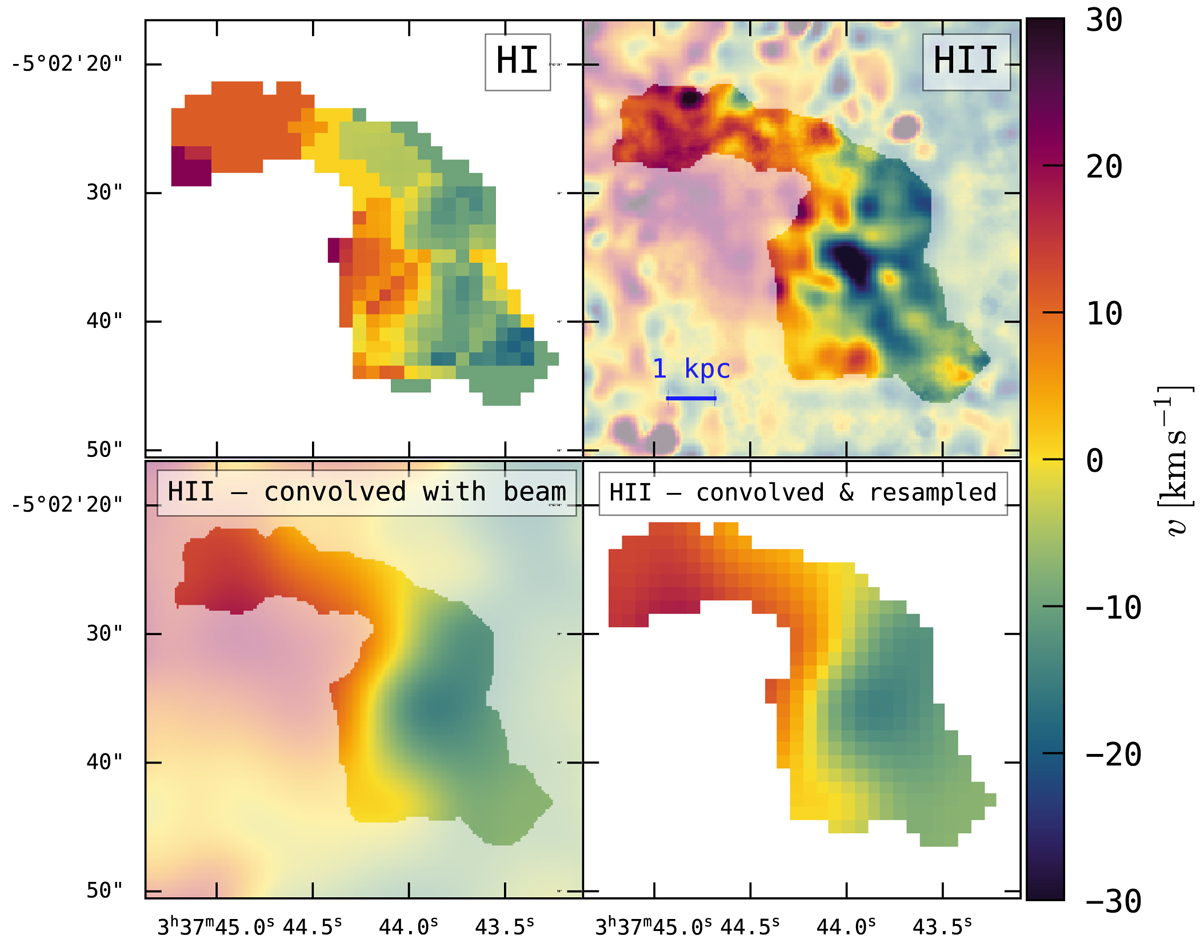
Fig. 14.
Download original image
Comparison between H I and H II kinematics on small scales. The H I velocity field (top left panel) is a zoomed-in view of the velocity field shown in the top panel Fig. 13. The H II velocity field (top right panel) is the same as in Fig. 12, but regions outside of detected H I have been subdued. In the bottom left panel we show the H II velocity field convolved with a 2D Gaussian (6.1″ × 4.6″, position angle −23.6°) to mimic the VLA B-configuration observations beam smearing (see text). The bottom right panel shows the smoothed Hα velocity field resampled onto the native grid of the VLA B-configuration cube.
Current usage metrics show cumulative count of Article Views (full-text article views including HTML views, PDF and ePub downloads, according to the available data) and Abstracts Views on Vision4Press platform.
Data correspond to usage on the plateform after 2015. The current usage metrics is available 48-96 hours after online publication and is updated daily on week days.
Initial download of the metrics may take a while.