Fig. 13.
Download original image
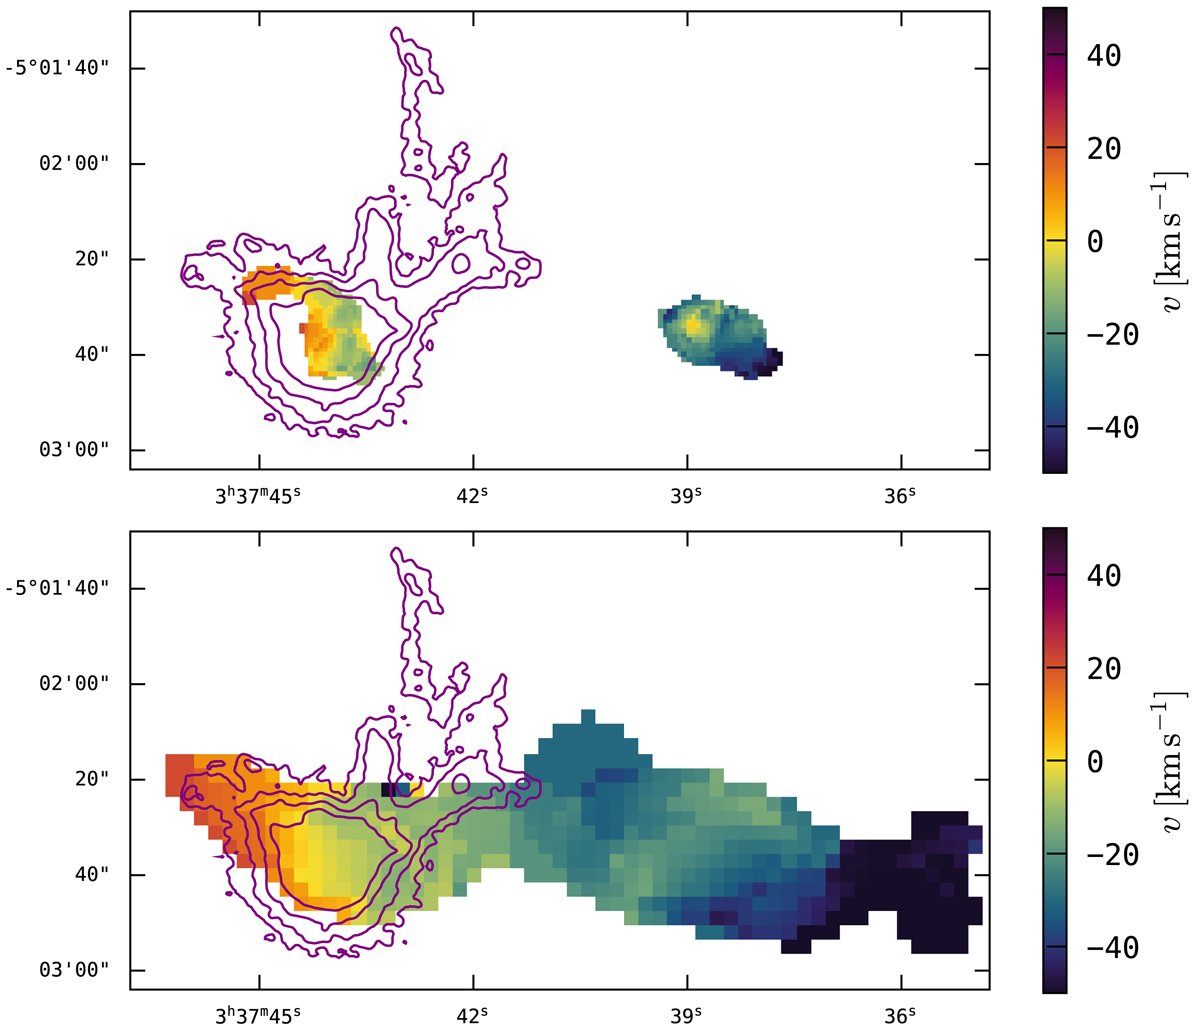
Moment-1 map from VLA-B configuration 21 cm data showing the intensity weighted line-of-sight velocity field of H I (top: untapered data; bottom: 7 kλ tapered data). The purple contours mark various Hα surface brightness levels as in Fig. 1. For the zero-point velocity the optical recession velocity from the eastern galaxy, v0 = c ⋅ z = 4053 km s−1 (Moiseev et al. 2010), was used.
Current usage metrics show cumulative count of Article Views (full-text article views including HTML views, PDF and ePub downloads, according to the available data) and Abstracts Views on Vision4Press platform.
Data correspond to usage on the plateform after 2015. The current usage metrics is available 48-96 hours after online publication and is updated daily on week days.
Initial download of the metrics may take a while.