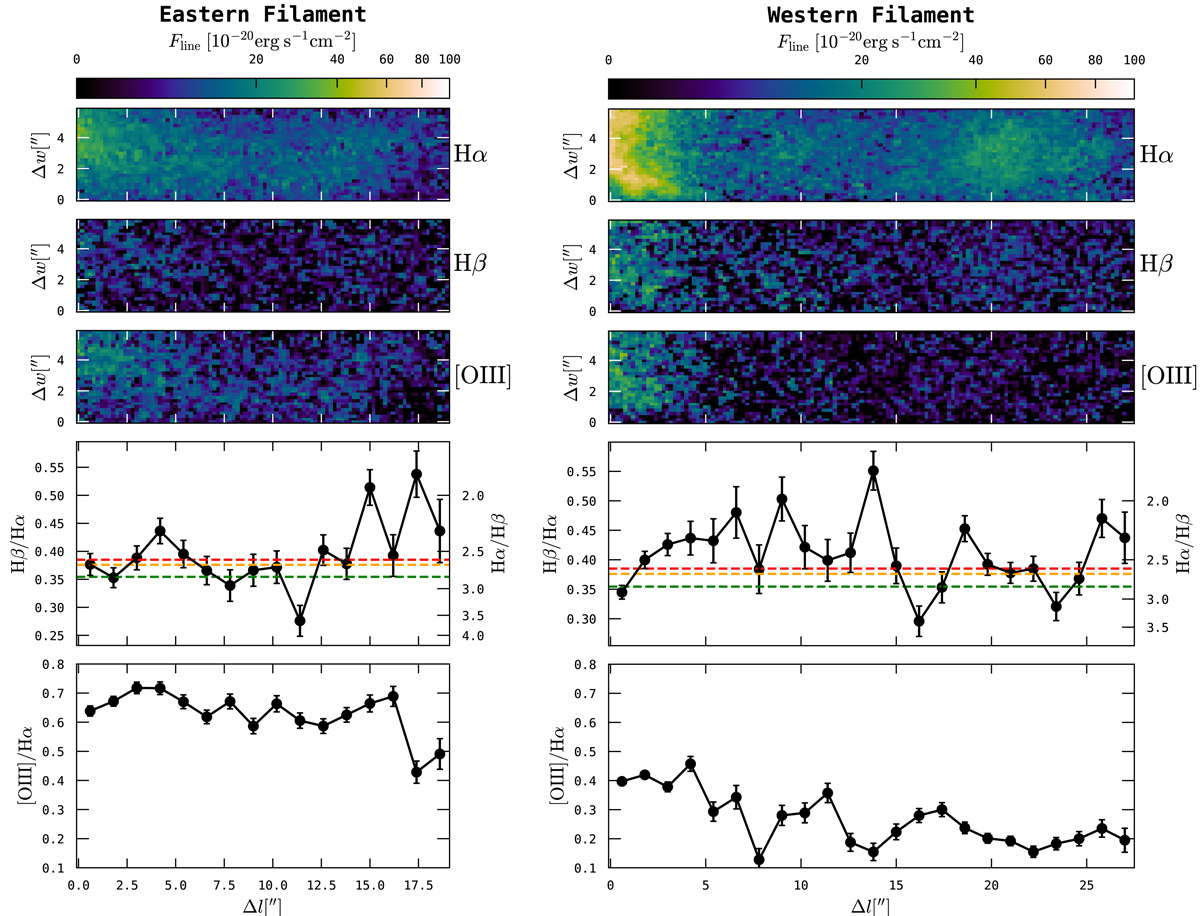
Fig. 10.
Download original image
Analysis of emission line ratios along the eastern (left) and western (right) filament. In the top three panels the emission in Hα, Hβ, and [O III] λ5007 is shown, now aligned such that the x-axis runs along the direction of the filament (Δl) and that the y-axis runs across the filament (Δw); the correpsonding areas have also been outlined in the bottom left panel of Fig. 1. The two bottom panels show the Hβ/Hα and [O III]/Hα ratio in bins of 1.2″ along Δl. These ratios are obtained after integrating the emission in each line along Δw. The 1-σ errors on the ratios have been computed with Eq. (2). For Hβ/Hα the Case-A recombination expectations from Storey & Hummer (1995), are indicated as dashed lines for three different temperatures (T = {1, 2, 3}×104 K in green, orange, and red); cf. Fig. 11. For Hβ/Hα the corresponding conventional Balmer decrement values are measured on the right ordinate.
Current usage metrics show cumulative count of Article Views (full-text article views including HTML views, PDF and ePub downloads, according to the available data) and Abstracts Views on Vision4Press platform.
Data correspond to usage on the plateform after 2015. The current usage metrics is available 48-96 hours after online publication and is updated daily on week days.
Initial download of the metrics may take a while.