Fig. 1.
Download original image
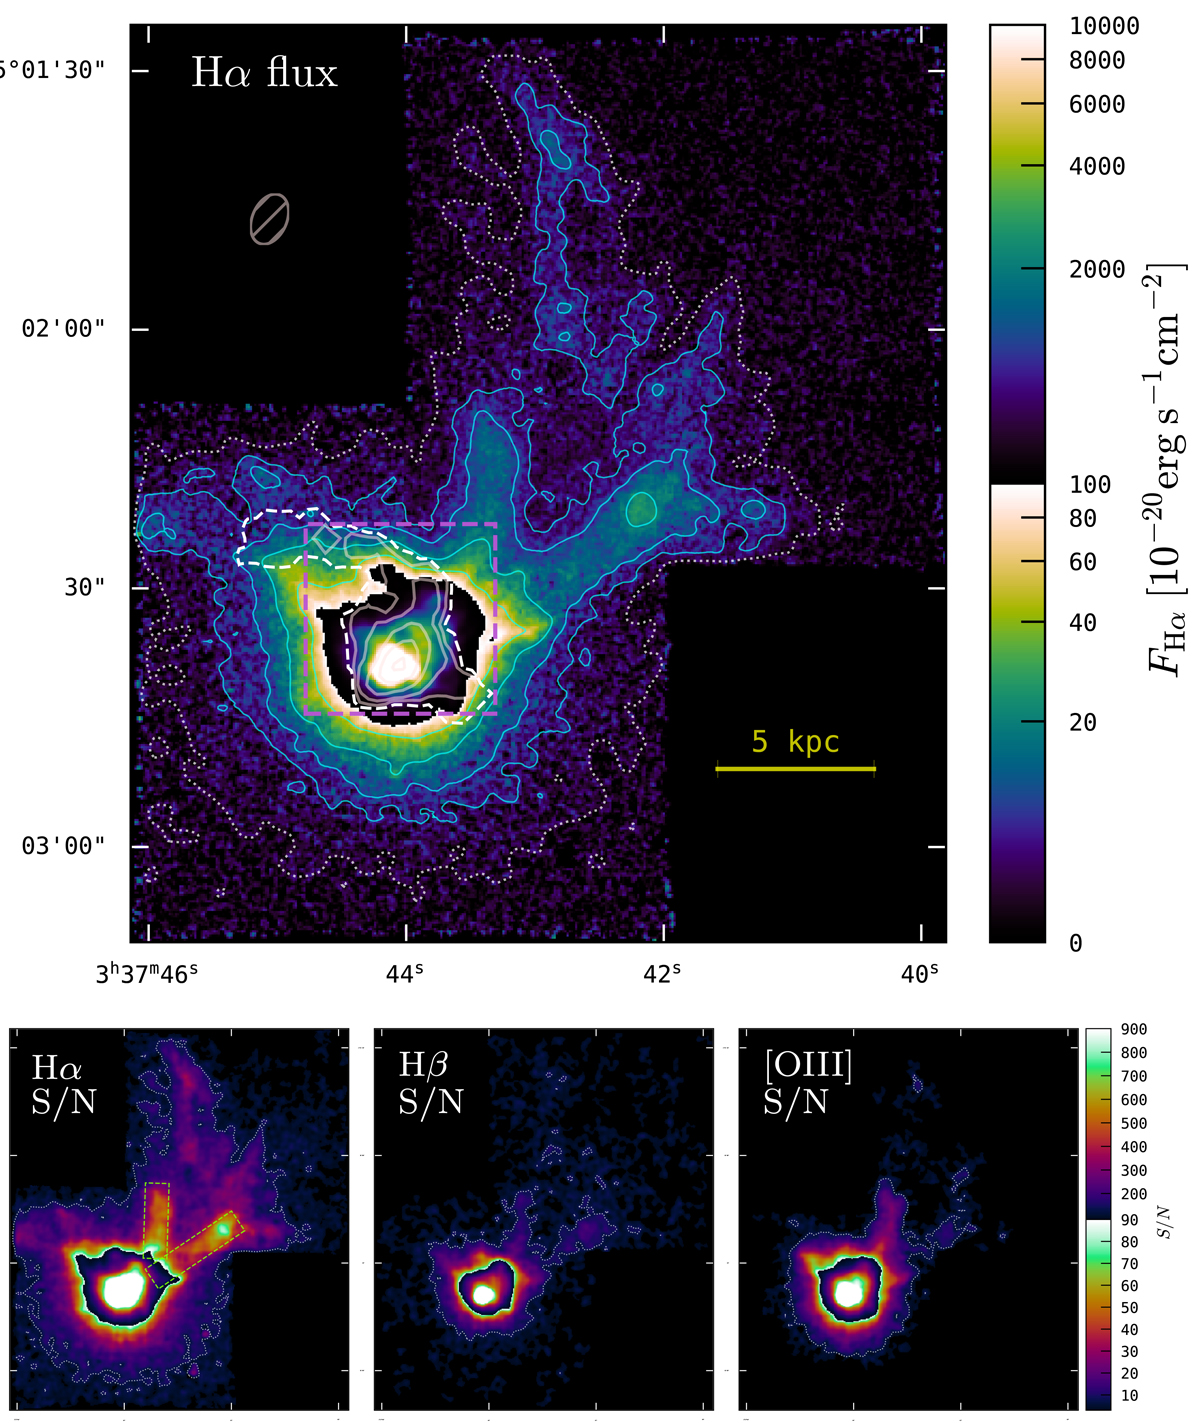
H II and H I emission as seen with MUSE and VLA around SBS 0335−052E. Top panel: continuum-subtracted Hα narrowband image. Fluxes are encoded via an asinh-scaled cyclic colour map from 0 to 10−18 erg s−1 cm−2 in the low surface-brightness, and from 10−18 erg s−1 cm−2 to 10−16 erg s−1 cm−2 in the central high surface-brightness region. The cyan solid contours demarcate Hα isophotes at SBHα = {1.5, 2.5, 5, 12.5}×10−18 erg s−1 cm−2 arcsec−2 while the white dotted contour demarcates the limiting surface-brightness of SBHα = 7.5 × 10⁻¹⁹ erg s−1 cm−2 arcsec−2. The image has been smoothed with a Gaussian of 0.4″ FWHM. Subdued grey contours indicate HI column densities NHI = {5, 10, 20, 30, 40}×1020 cm−2 from our VLA-B configuration observations; these contours are displayed more prominently in Fig. 4. The dashed white contour demarcates the 2.5σ = 2.5 × 1020 cm−2 detection limit. The VLA-B configuration beam, 6.1″ × 4.6″ oriented 23.6° west of north, is indicated via a grey shaded ellipse in the top left. The displayed field of view is 1′35″ × 1′46″ corresponding to 26.2 kpc × 29.2 kpc in projection. The dashed violet square in the centre indicates the viewport used in Fig. 4. North is up and east is to the left. Bottom panels: signal-to-noise of the three principal emission lines (Hα, Hβ, and [O III] λ5007 in the left, centre, and right panel, respectively) in which extended ionised gas is detected (see text for details). The maps are displayed with a linear cyclic colour map from 0 to 90 and from 90 to 900. White dotted contours mark out regions with SN > 8. The chartreuse dashed rectangles in the Hα panel outline the rectangular regions used for the line ratio analysis in Sect. 3.2.
Current usage metrics show cumulative count of Article Views (full-text article views including HTML views, PDF and ePub downloads, according to the available data) and Abstracts Views on Vision4Press platform.
Data correspond to usage on the plateform after 2015. The current usage metrics is available 48-96 hours after online publication and is updated daily on week days.
Initial download of the metrics may take a while.