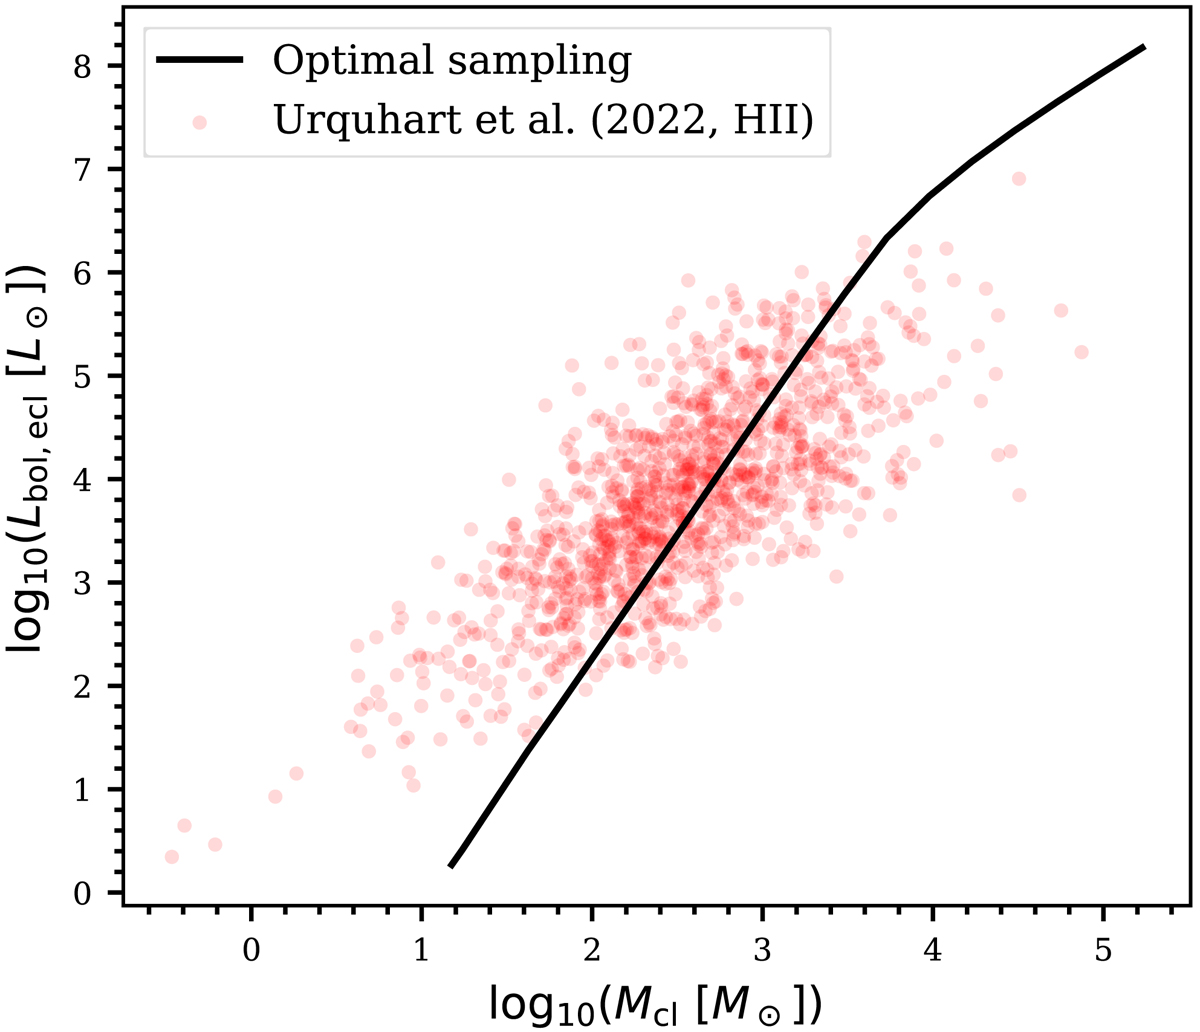
Fig. 10.
Download original image
Total stellar bolometric luminosity–pre-cluster molecular cloud mass relation. The solid curve shows the prediction from the optimal sampling method, where the cluster mass relates to the mass of each star formed in that cluster deterministically, according to Eqs. (7)–(10). The total stellar luminosity is calculated with Eq. (12). The red circles are the observational data adopted from Urquhart et al. (2022); specifically their clumps related to HII regions.
Current usage metrics show cumulative count of Article Views (full-text article views including HTML views, PDF and ePub downloads, according to the available data) and Abstracts Views on Vision4Press platform.
Data correspond to usage on the plateform after 2015. The current usage metrics is available 48-96 hours after online publication and is updated daily on week days.
Initial download of the metrics may take a while.