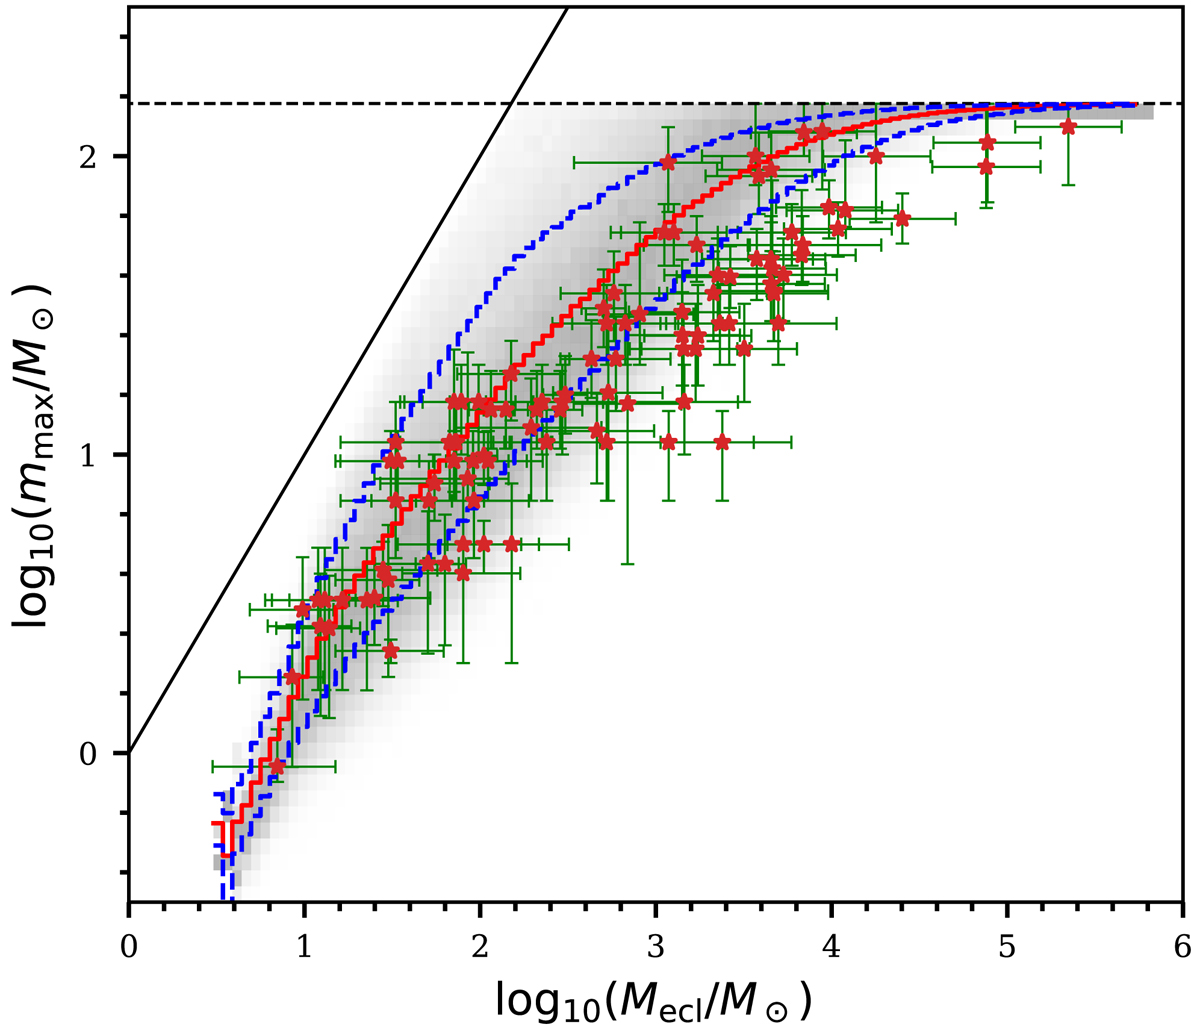
Fig. 1.
Download original image
Most massive stellar mass to embedded cluster mass (mmax − Mecl) relation. Red stars denote the observational data listed in Table A.1. Here, 106 synthetic clusters are stochastically sampled from the canonical IMF (the a23m150 IMF model in Table 1), resulting in the density map. The darkness of the region is proportional to the number of the synthetic clusters in that region divided by the total number of synthetic clusters in the same Mecl bin. The average mmax and standard deviation of mmax for each Mecl bin are plotted as the red solid and the blue dashed curves, respectively. The solid line indicates the Mecl = mmax limit and the horizontal dashed line indicates the mup limit of 150 M⊙ (see Sect. 7.4.4).
Current usage metrics show cumulative count of Article Views (full-text article views including HTML views, PDF and ePub downloads, according to the available data) and Abstracts Views on Vision4Press platform.
Data correspond to usage on the plateform after 2015. The current usage metrics is available 48-96 hours after online publication and is updated daily on week days.
Initial download of the metrics may take a while.