Fig. 5
Download original image
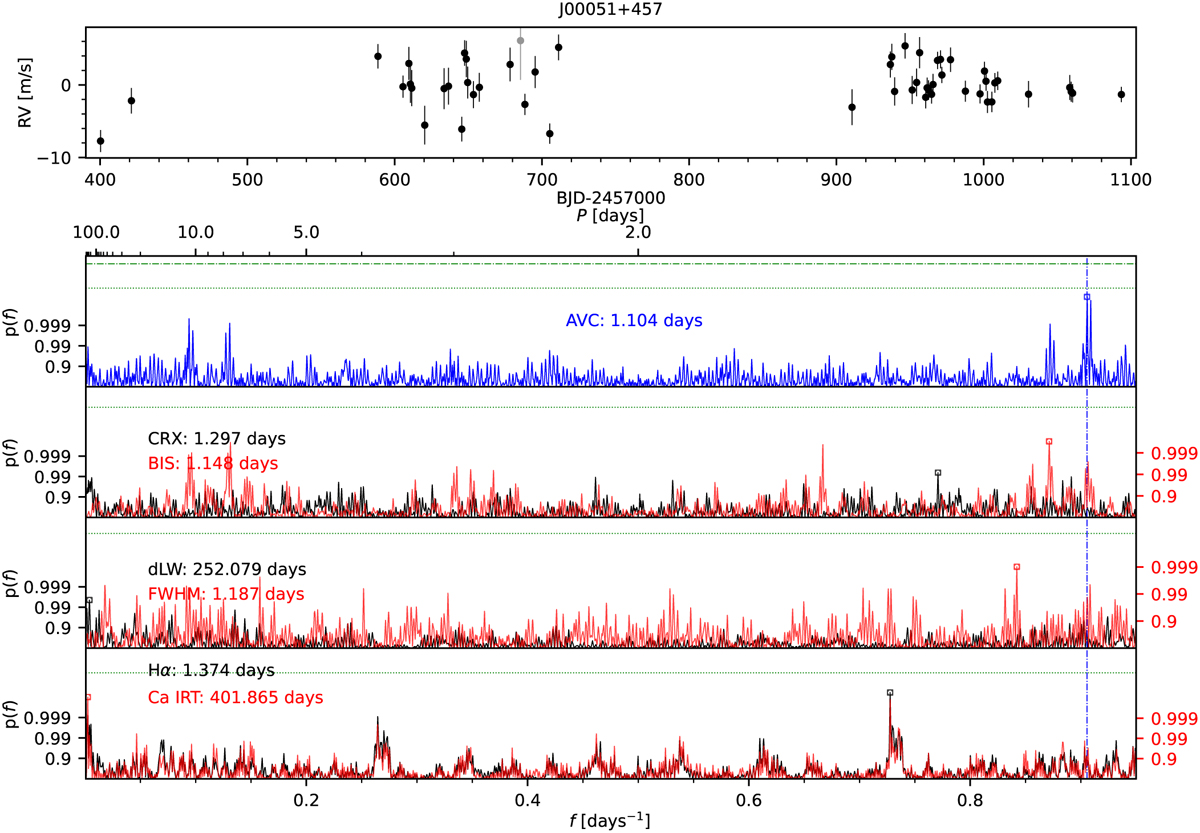
Time series data and periodograms for target J00051+457 (GJ 2). Top panel: NZP-corrected RV time series. Outlier measurements (grey symbols; see text) are excluded in the periodogram calculation. Bottom panels (from top to bottom): GLS periodograms of the NZP-corrected RVs (AVC, blue), the chromatic index (CRX, black) and CCF bisector span (BIS, red), the differential line width (dLW, black) and the CCF FWHM (red), and the chromospheric activity indices corresponding to the Ha (black) and averaged Ca II IRT lines (red). The dash-dotted blue vertical line in all panels marks the position of the most significant peak in the RV periodogram, while the circles in the sub-panels highlight the position of the strongest signal in each periodogram, with the period given in the legend. The 0.1%, 1%, and 10% FAP levels are shown as horizontal dashed, dash-dotted, and dotted green lines, respectively, and are visible if they fall within the displayed vertical range. Vertical axes in panels that show two different datasets are scaled such that the FAP levels are identical. The colour code allows the graph to be related with the axis labels and legends.
Current usage metrics show cumulative count of Article Views (full-text article views including HTML views, PDF and ePub downloads, according to the available data) and Abstracts Views on Vision4Press platform.
Data correspond to usage on the plateform after 2015. The current usage metrics is available 48-96 hours after online publication and is updated daily on week days.
Initial download of the metrics may take a while.