Fig. 12
Download original image
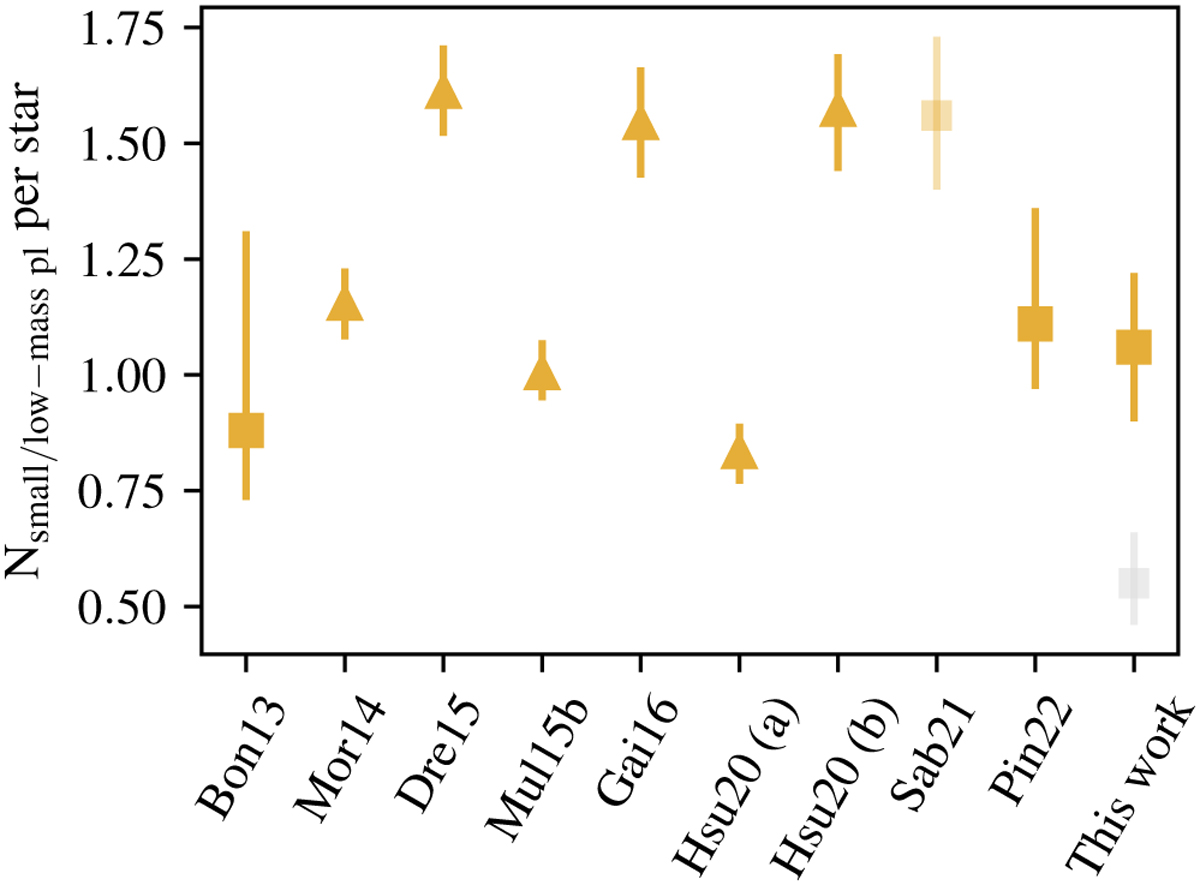
Comparison of low-mass/small planet occurrence rates from various surveys (adapted from Sab21). The parameter range is 1 to 10 M⊕ in Mpl sin i for RV surveys and 1.3 to 3.7 R⊕ in Rpl for transit surveys. The error bars for transit surveys are Poisson errors based on the number of planet detections in the respective bins, and error bars from RV surveys are the 16% and 84% levels of the occurrence rate posterior distributions. Results using transiting planets from the Kepler mission are represented as triangles (Morton & Swift 2014; Dressing & Charbonneau 2015; Mulders et al. 2015; Gaidos et al. 2016; Hsu et al. 2020), and rates from the HARPS, HADES, and CARMENES RV surveys are represented as squares (Bonfils et al. 2013; Sabotta et al. 2021; Pinamonti et al. 2022, and this work). The grey square shows the occurrence rate from this work with the assumption of a log-uniform distribution in Mpl sin i.
Current usage metrics show cumulative count of Article Views (full-text article views including HTML views, PDF and ePub downloads, according to the available data) and Abstracts Views on Vision4Press platform.
Data correspond to usage on the plateform after 2015. The current usage metrics is available 48-96 hours after online publication and is updated daily on week days.
Initial download of the metrics may take a while.