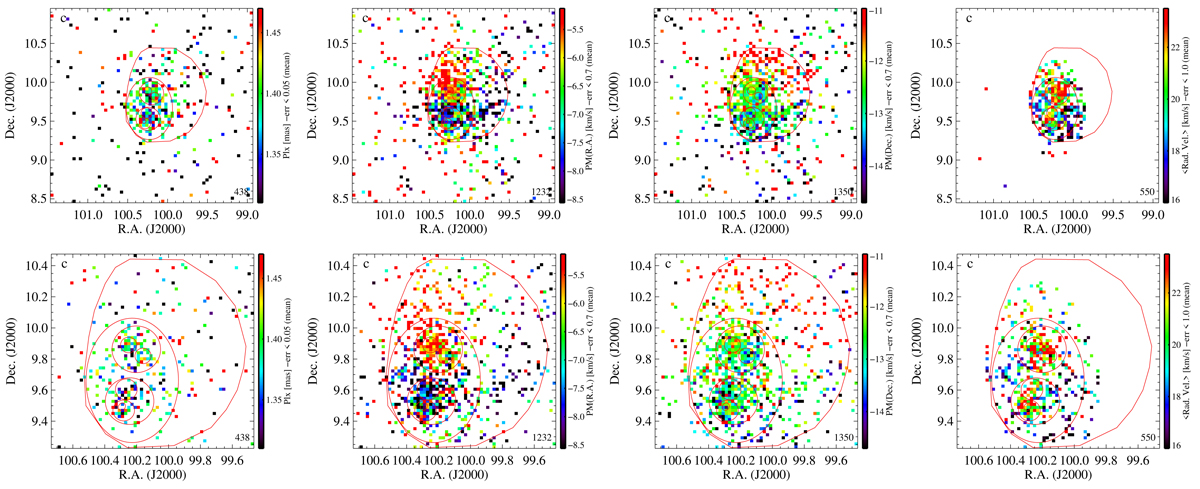
Fig. 9.
Download original image
Spatial distributions for sample “c”, color-coded according to four different variables. The top row refers to our full FoV, while the bottom row shows the central area in better detail. Within each row, the panels show, from left to right: parallax, PMRA, PMDec., and radial velocity. Color are assigned using the average value of the variable for all stars within each pixel and following the scale on the right-hand side of each panel. Most pixels on the outskirts contain a single star. The numbers on the bottom left indicate the number of stars used for the panel.
Current usage metrics show cumulative count of Article Views (full-text article views including HTML views, PDF and ePub downloads, according to the available data) and Abstracts Views on Vision4Press platform.
Data correspond to usage on the plateform after 2015. The current usage metrics is available 48-96 hours after online publication and is updated daily on week days.
Initial download of the metrics may take a while.