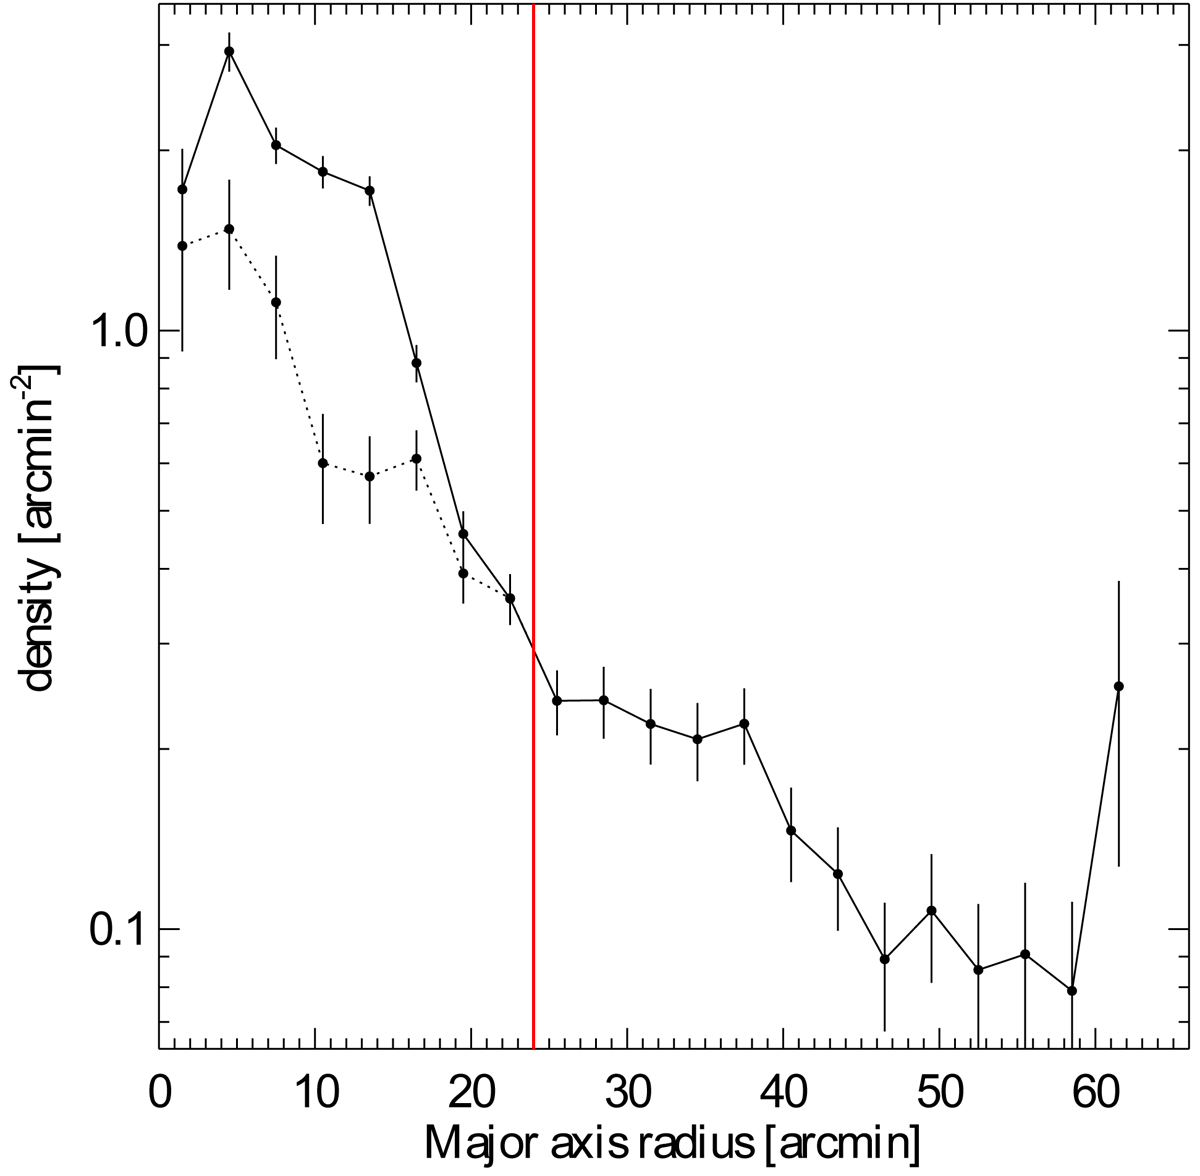
Fig. 8.
Download original image
Density profile of sample “c” members within the Extended Halo* subregion. Densities plotted as a solid line are computed in the intersection between the Extended Halo* region and elliptical annuli, concentric with those used in Fig. 6. The dotted line is the result of excluding the dense S Mon* and Cone* region. The vertical red line indicates the boundary of the Halo region.
Current usage metrics show cumulative count of Article Views (full-text article views including HTML views, PDF and ePub downloads, according to the available data) and Abstracts Views on Vision4Press platform.
Data correspond to usage on the plateform after 2015. The current usage metrics is available 48-96 hours after online publication and is updated daily on week days.
Initial download of the metrics may take a while.