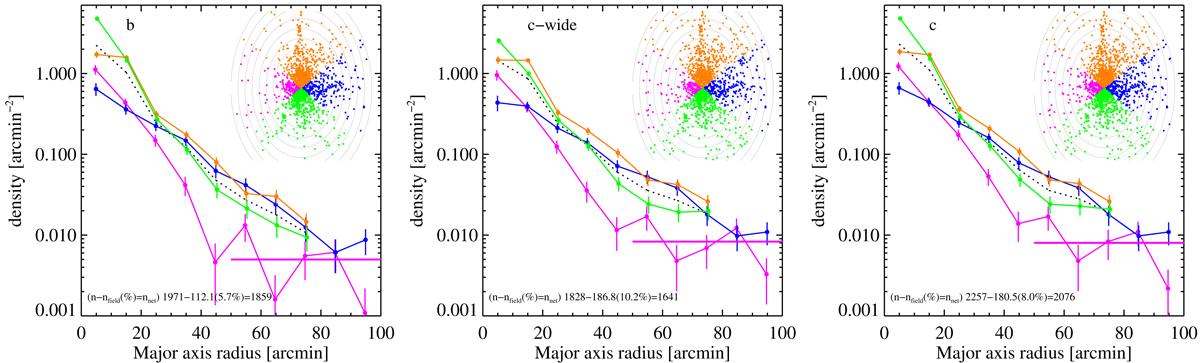
Fig. 6.
Download original image
“Radial” distributions for samples “b”, “c-wide”, and “c”. Different colors refer to different “quadrants”. Spatial distributions are shown at the top-right of each panel, with stars color-coded according to their quadrant. The elliptical annuli where the densities for the main plot were computed are also shown. Points with error bars, based on Poisson uncertainties, are slightly shifted along the x-axis to avoid overlap among the four independent samples. The dotted black line refer to the combination of the four quadrants. The thick horizontal magenta segments toward the bottom right indicate the average densities of stars in the left quadrant for r > 50 arcmin.
Current usage metrics show cumulative count of Article Views (full-text article views including HTML views, PDF and ePub downloads, according to the available data) and Abstracts Views on Vision4Press platform.
Data correspond to usage on the plateform after 2015. The current usage metrics is available 48-96 hours after online publication and is updated daily on week days.
Initial download of the metrics may take a while.