Fig. 5.
Download original image
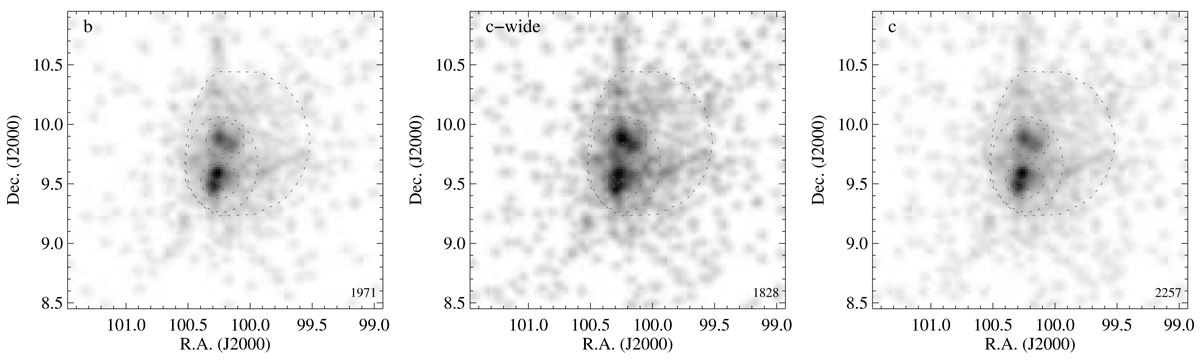
Spatial distributions for candidate member samples “b”, “c-wide”, and “c” (from left to right). The density maps are smoothed with a Gaussian kernel as in Fig. 4, and dotted lines show the boundaries of the regions discussed in the text (Sect. 4.3) and also shown in Fig. 1. The figures at the bottom right of each panel indicate the number of objects in the sample.
Current usage metrics show cumulative count of Article Views (full-text article views including HTML views, PDF and ePub downloads, according to the available data) and Abstracts Views on Vision4Press platform.
Data correspond to usage on the plateform after 2015. The current usage metrics is available 48-96 hours after online publication and is updated daily on week days.
Initial download of the metrics may take a while.