Open Access
Fig. 14.
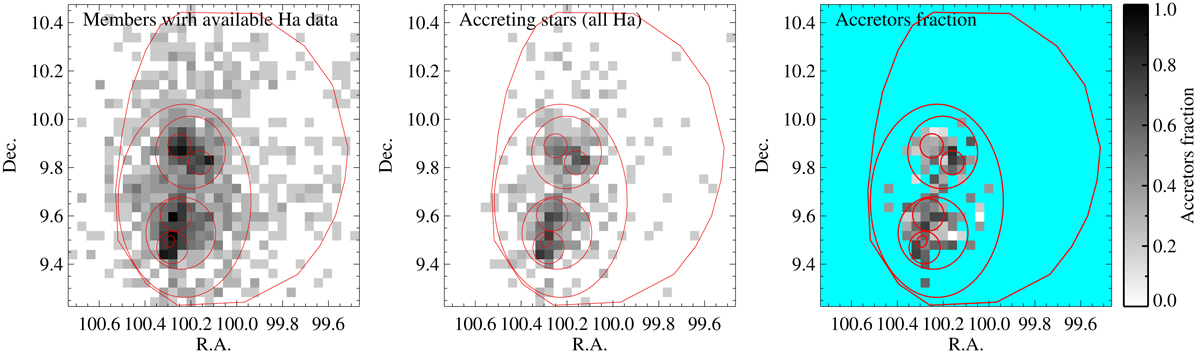
Download original image
Same as Fig. 13, but for the accretion indicators. The leftmost panel shows stars placed in any of the five Hα based diagrams, the central one those lying in any of the five accretion loci, and the rightmost one the ratio between the former two maps.
Current usage metrics show cumulative count of Article Views (full-text article views including HTML views, PDF and ePub downloads, according to the available data) and Abstracts Views on Vision4Press platform.
Data correspond to usage on the plateform after 2015. The current usage metrics is available 48-96 hours after online publication and is updated daily on week days.
Initial download of the metrics may take a while.