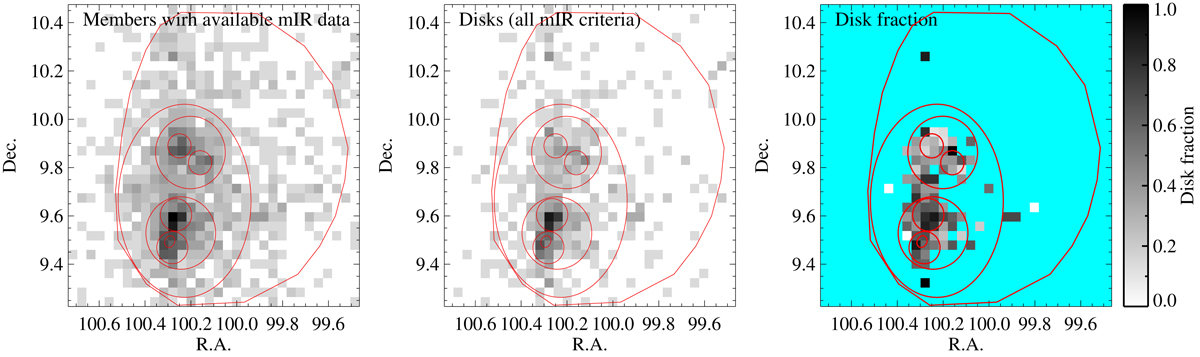
Fig. 13.
Download original image
Binned spatial maps of (from left to right): i) stars placed in either of the two mIR based diagrams from which we assess the presence of disks, ii) stars with disks, iii) the fraction of stars with disks. In the rightmost plot the gray scale follows the color-bar on the right-hand side, and the spatial bins in which the denominator of the fraction contained less than 5 stars are plotted in cyan.
Current usage metrics show cumulative count of Article Views (full-text article views including HTML views, PDF and ePub downloads, according to the available data) and Abstracts Views on Vision4Press platform.
Data correspond to usage on the plateform after 2015. The current usage metrics is available 48-96 hours after online publication and is updated daily on week days.
Initial download of the metrics may take a while.