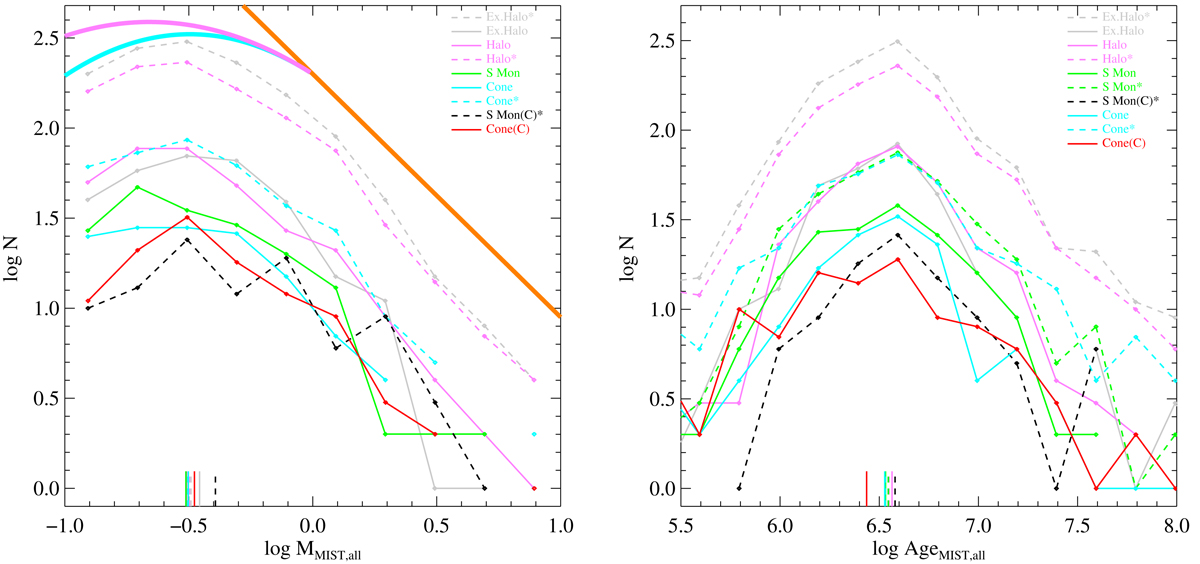
Fig. 12.
Download original image
Logarithmic mass and age distributions (left and right panels, respectively) for selected subregions, color coded as in the caption in the upper right corner. For regions with nested subregions, dashed lines refer to the whole area within their perimeters, and solid lines to the ‘haloes’. Thick solid lines in the left panel show the Salpeter’s Initial Mass Function (IMFs, Salpeter 1955, slope −1.35) in orange, and the Chabrier (2003) system and single stars IMF, for M < M⊙, in cyan and magenta, respectively. The short vertical lines near the x-axes, at log M ∼ −0.5 and log Age ∼ 6.5, indicate the median values of each samples.
Current usage metrics show cumulative count of Article Views (full-text article views including HTML views, PDF and ePub downloads, according to the available data) and Abstracts Views on Vision4Press platform.
Data correspond to usage on the plateform after 2015. The current usage metrics is available 48-96 hours after online publication and is updated daily on week days.
Initial download of the metrics may take a while.