Fig. 11.
Download original image
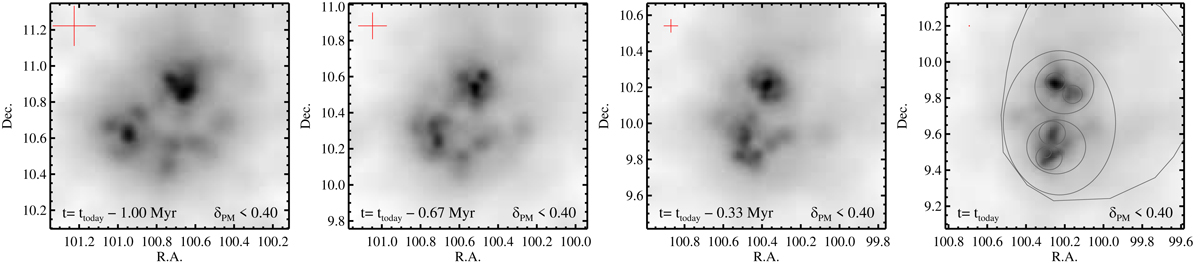
Spatial densities predicted at three past epochs: 1, 0.67, and 0.33 Myr (from left to right) in the past, plus the present one (on the right). As indicated in the panels, only stars with PM uncertainties < 0.4 mas yr−1 are used and the maximum 1σ uncertainties for the reprojected position are indicated by the red cross in the upper-left corner. The density maps are smoothed with an adaptive kernel as in Fig. 7.
Current usage metrics show cumulative count of Article Views (full-text article views including HTML views, PDF and ePub downloads, according to the available data) and Abstracts Views on Vision4Press platform.
Data correspond to usage on the plateform after 2015. The current usage metrics is available 48-96 hours after online publication and is updated daily on week days.
Initial download of the metrics may take a while.