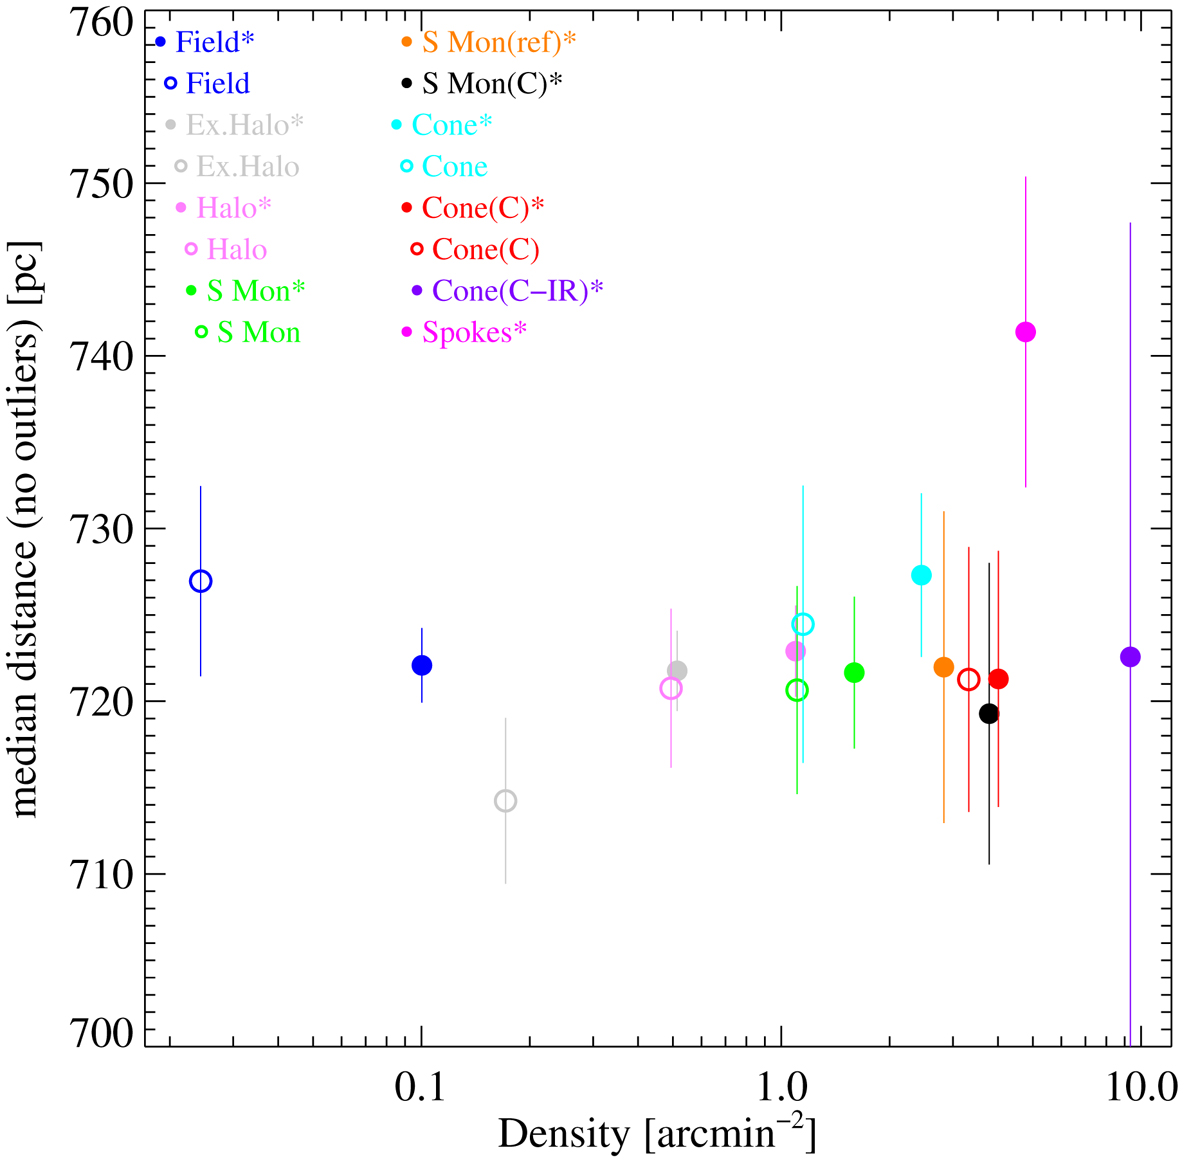
Fig. 10.
Download original image
Distance vs. average stellar density for all the defined subregions. Distances are computed as the median of all stars with Gaia parallaxes in each subregion, excluding outliers (see text). Error bars refer to uncertainties on the median values. Filled symbols refer to the whole area within a region perimeter, while empty symbols to “haloes”, i.e. excluding nested regions, if present. The color coding is as in the legend.
Current usage metrics show cumulative count of Article Views (full-text article views including HTML views, PDF and ePub downloads, according to the available data) and Abstracts Views on Vision4Press platform.
Data correspond to usage on the plateform after 2015. The current usage metrics is available 48-96 hours after online publication and is updated daily on week days.
Initial download of the metrics may take a while.