Fig. 1.
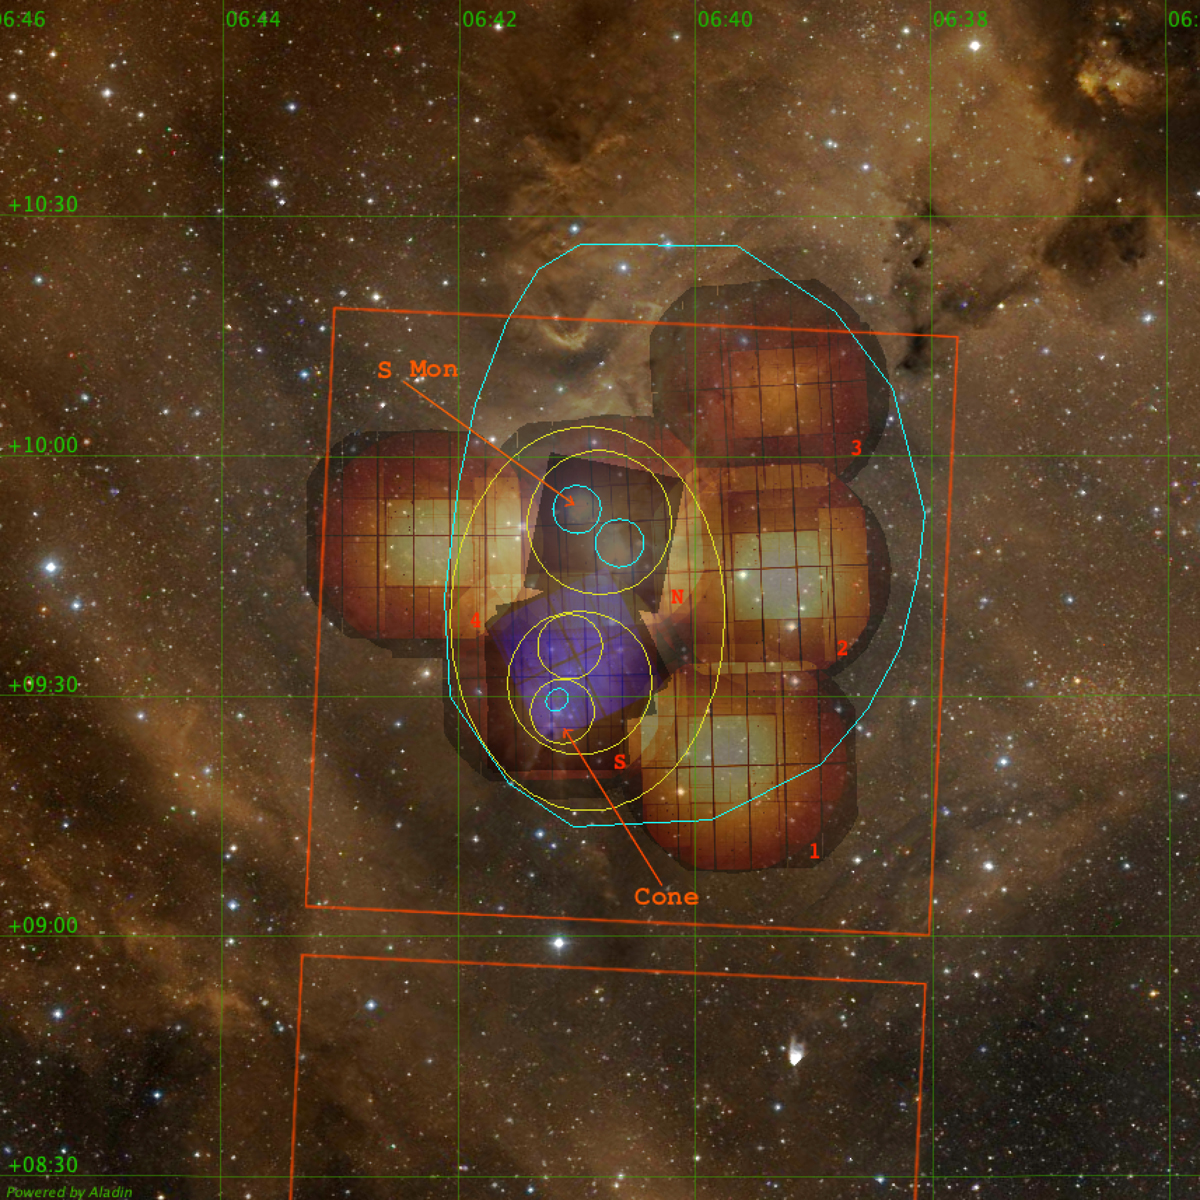
Download original image
Optical DSS2 image of the 2.5×2.5 deg square field centered on NGC 2264 to which our study is limited. The locations of two prominent features, the O7 star S Mon and the Cone Nebula, are indicated by orange arrows. The areas shaded in blue and orange-brown are combined exposure maps of all available Chandra and XMM-Newton observations, respectively. Identifiers for the XMM-Newton field are also shown by red symbols in their respective lower-right corner. The two orange squares indicate the FoV of the CoRoT observations discussed in Sect. 2. The yellow circles and ellipse indicate the subregions identified by Sung et al. (2009). Contours of the four new spatial substructures identified in this study (Sect. 4.3), three inner ones and the outer polygon, are drawn in cyan.
Current usage metrics show cumulative count of Article Views (full-text article views including HTML views, PDF and ePub downloads, according to the available data) and Abstracts Views on Vision4Press platform.
Data correspond to usage on the plateform after 2015. The current usage metrics is available 48-96 hours after online publication and is updated daily on week days.
Initial download of the metrics may take a while.