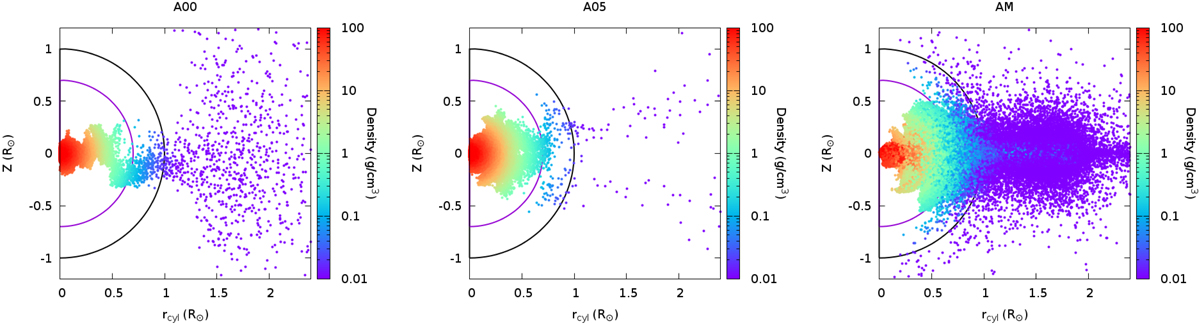
Fig. 7.
Download original image
Particle distribution of the BD projected in the 2D cylindrical plane for the A scenarios, at the end of the simulations: t = 10 689 s and t = 8059 s in the head-on and grazing collision cases (left and central, respectively) and t = 38 402 s for the merger scenario (right). The semicircles represent the original solar radius (solid black line) and the bottom of the convective zone at ∼70% of the solar radius (solid purple line). The density is color-coded.
Current usage metrics show cumulative count of Article Views (full-text article views including HTML views, PDF and ePub downloads, according to the available data) and Abstracts Views on Vision4Press platform.
Data correspond to usage on the plateform after 2015. The current usage metrics is available 48-96 hours after online publication and is updated daily on week days.
Initial download of the metrics may take a while.