Open Access
Fig. 4.
Download original image
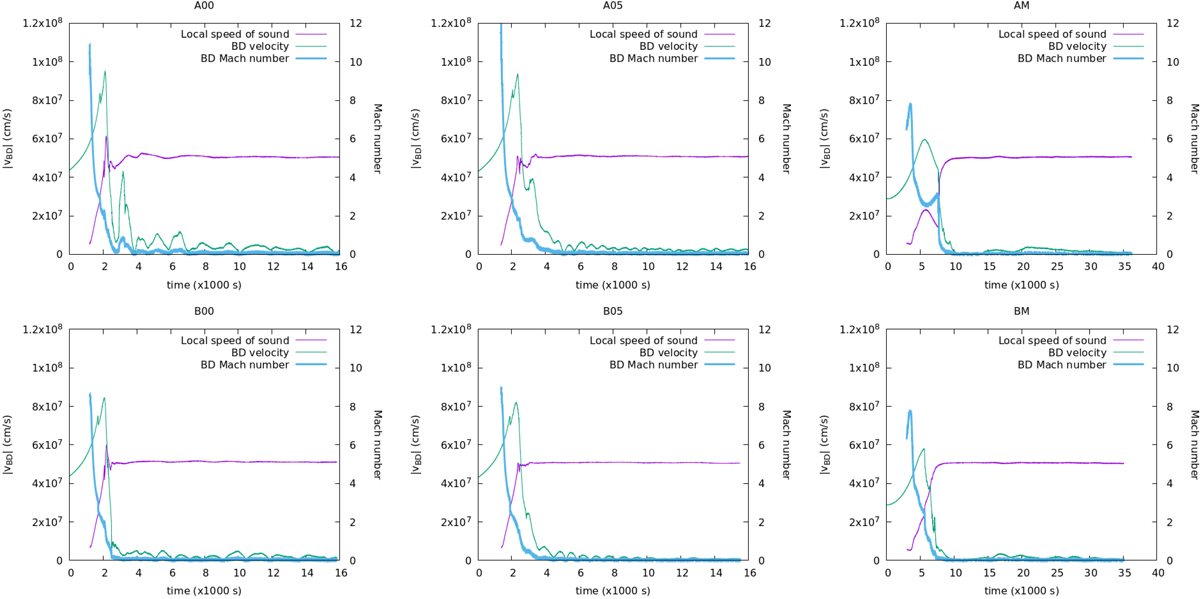
BD velocity evolution (green line) compared with the local speed of sound of the surrounding MS star’s material (purple line). The BD Mach number evolution is shown in blue. The top panels show the A models, while the bottom panels are for the B models.
Current usage metrics show cumulative count of Article Views (full-text article views including HTML views, PDF and ePub downloads, according to the available data) and Abstracts Views on Vision4Press platform.
Data correspond to usage on the plateform after 2015. The current usage metrics is available 48-96 hours after online publication and is updated daily on week days.
Initial download of the metrics may take a while.