Fig. 6
Download original image
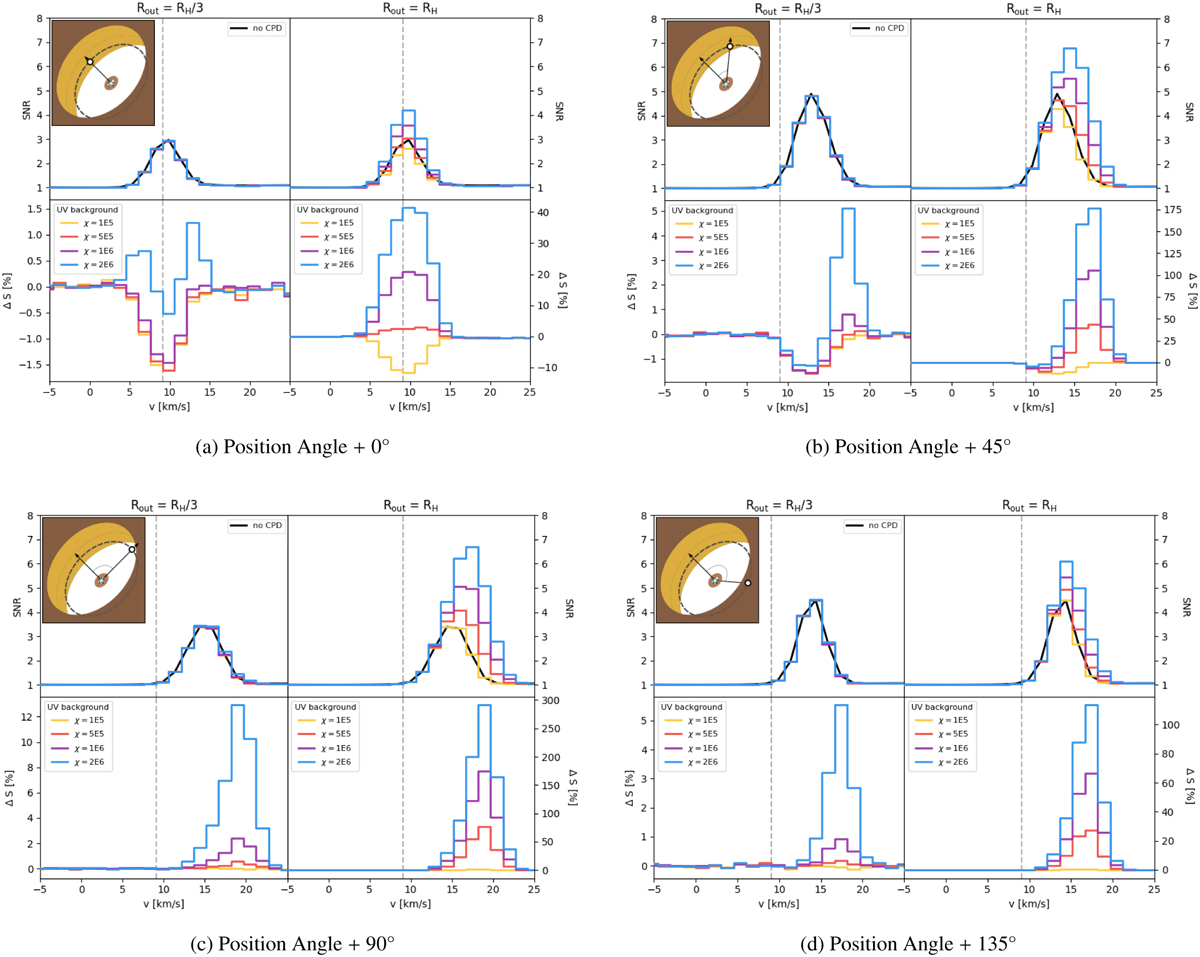
12CO line profiles represented as the signal-to-noise ratio (S/N) of the aperture centered on the CPD (top row of each subfigure) compared to the case of no CPD (black line) for the CPDs with varying levels of background UV irradiation χ. Excess or deficit in flux ∆S in the aperture relative to a no-CPD model (bottom row of each subfigure). Results are shown for a companion position angle relative to the disk semiminor axes of (a) 0°, (b) 45°, (c) 90°, and (d) 135°. The signal present in the case of no CPD is indicated by the black lines, and arises purely from circumstellar disk emission. The rest frame of the star is indicated by the vertical dashed gray lines. A negative AS indicates that the CPD is seen in absorption. Note: the vertical axis scaling can differ significantly between the left and right sides of each subfigure.
Current usage metrics show cumulative count of Article Views (full-text article views including HTML views, PDF and ePub downloads, according to the available data) and Abstracts Views on Vision4Press platform.
Data correspond to usage on the plateform after 2015. The current usage metrics is available 48-96 hours after online publication and is updated daily on week days.
Initial download of the metrics may take a while.