Fig. 5
Download original image
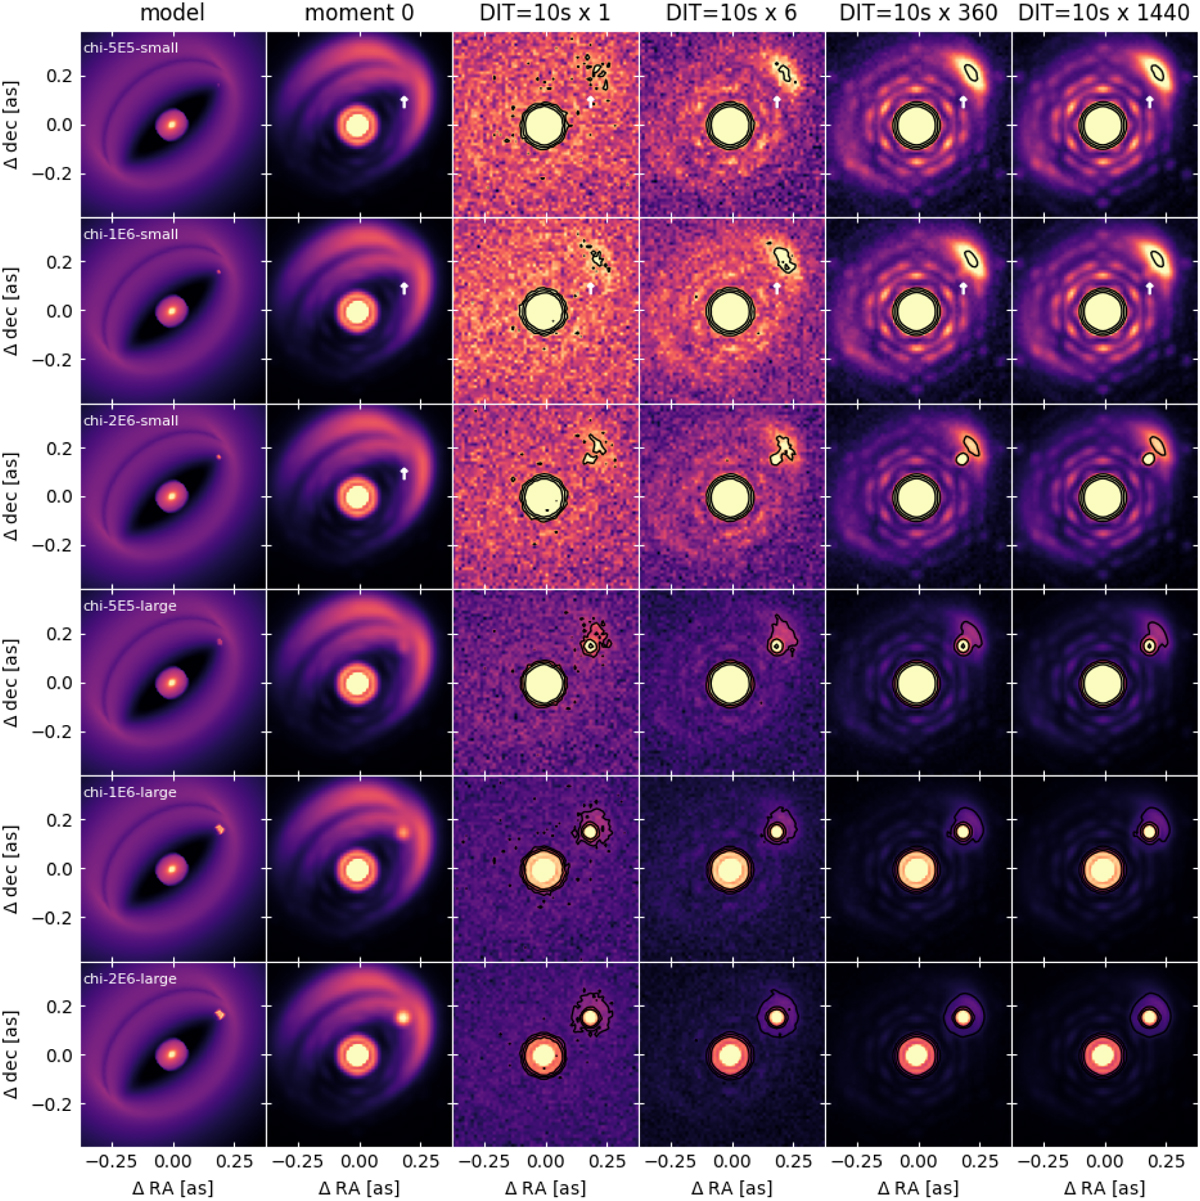
Synthetic channel maps of v(1−0)P08 line (4.73587 µm) from the CPDs of varying physical extent and background irradiation. The CPD is placed at maximum elongation (θ = 90°) The leftmost column contains the input model at the extracted velocity (+6.8 km s−1 relative to the stellar reference frame). The asymmetry in the moment 0 map in column 2 is due to telluric contamination. The third to sixth columns include the synthetic channel maps for an increasing series of total detector integration times indicated at the top of each column. The black contours indicate a count value excess relative to the background of 25%, 50%, and 100%. The color range of each image has been logarithmically scaled with boundaries corresponding to the minimum and maximum values found outside of the central half of the stellar PSF. Where it is not apparent by eye the position of the CPD is indicated with a white vertical arrow. The six-fold symmetry apparent in longer integration times is a result of the ELT point spread function acting on the central star. The colormap normalization has been configured to maximize the visibility of the CPD.
Current usage metrics show cumulative count of Article Views (full-text article views including HTML views, PDF and ePub downloads, according to the available data) and Abstracts Views on Vision4Press platform.
Data correspond to usage on the plateform after 2015. The current usage metrics is available 48-96 hours after online publication and is updated daily on week days.
Initial download of the metrics may take a while.